

What are models in Data Science

Certifications:

What are models in Data Science?
In a simple sentence, models are built so that we can make predictions about a trend we are investigating.
There are two categories of models supervised which we train and unsupervised which is done through neural networks.
In the article we will deal with the first category which has 3 subcategories regression, classification and decision tree.
The most familiar categories when we use regression
THE Linear which we try with a straight line to pass through all the price points.
THE Polynomial which depending on its degree we can use multiple parameters so that it approaches more points.
The problem that arises
Many times it is the right balance as the better the model fits the points there is a greater chance that future points will have a greater deviation and so we have overfitting.
Underfitting we have when the model does not go through most of the points then maybe we should change the model type or increase the degrees/folds.
Each model needs to be trained at first with a percentage of data and the remaining percentage is used for testing.
How accurate the model is
It is distinguished by its prices R^2 (how little deviation the values have from the model line) with values from 0~1.
As also from RMSE (the square of the mean of the difference between the predicted values and the actual values) with values above zero and when we say zero it means that we have the perfect model which sets it as impossible.
Detailed example
First we'll load all the libraries I might need so we don't get confused later.
import itertools

import numpy as np

import matplotlib.pyplot as plt

from matplotlib.ticker import NullFormatter

import pandas as pd

import numpy as np

import matplotlib.ticker as ticker

from sklearn import preprocessing

from sklearn.ensemble import RandomForestRegressor

from sklearn.linear_model import RidgeClassifier

from sklearn.model_selection import cross_val_score

from sklearn.model_selection import train_test_split

from sklearn.tree import DecisionTreeClassifier

from sklearn.metrics import f1_score

from sklearn.metrics import jaccard_similarity_score

from sklearn import svm

from sklearn import preprocessing

from sklearn.impute import SimpleImputer

from sklearn.linear_model import Ridge

from sklearn.linear_model import LinearRegression

from sklearn.preprocessing import StandardScaler,PolynomialFeatures

import seaborn as sns

%matplotlib inline

#!conda install -c anaconda seaborn -y
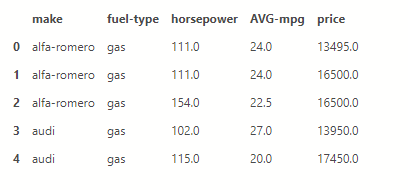
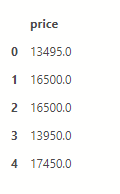
We load a csv with car details into a dataframe, keep as many shipments as we want and make a modification to get the average consumption.
df = pd.read_csv('https://gist.githubusercontent.com/smatzouranis/acd3354f30ecc1e7cb90caee84650c3a/raw/61adad1fca973303f4af8bc378b3a5432b7371e7/autos_csv.csv')

df = df[['make','fuel-type','horsepower','city-mpg','highway-mpg','price']]

df['AVG-mpg'] = (df['city-mpg']+df['highway-mpg'])/2

dff = df[['make','fuel-type','horsepower','AVG-mpg','price']]

dff.head()
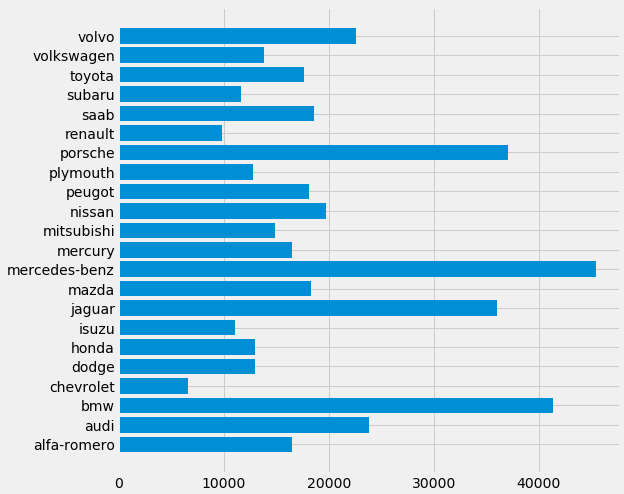
Bar plot
Let's make a quick bar plot of the cost per brand.
It only needs 5 command lines.
makers = dff['make']

prices = dff['price']

fig, ax = plt.subplots(figsize=(8, 8))

plt.style.use('fivethirtyeight')

ax.barh(makers, prices)
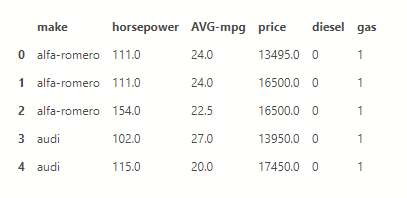
Data preparation
Because we had text on what fuel each name has we will make new columns one for oil and one for gasoline with 0 or 1 depending on what it has with the command .get_dummies and to pass the change you need the parameter inplace=True
dff = pd.concat([dff,pd.get_dummies(dff['fuel-type'])], axis=1)

dff.drop(['fuel-type'], axis = 1,inplace=True)

dff.head()
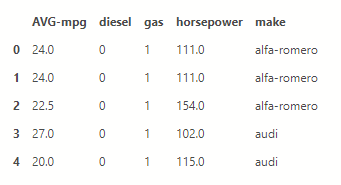
Now we will fill in the cars that do not have a price an average price from the rest.
X = dff[dff.columns.difference(['price'])]

X =X.fillna(X.mean())

X.head()
y = dff[['price']]

y =y.fillna(y.mean())

y[0:5]
Linear regression
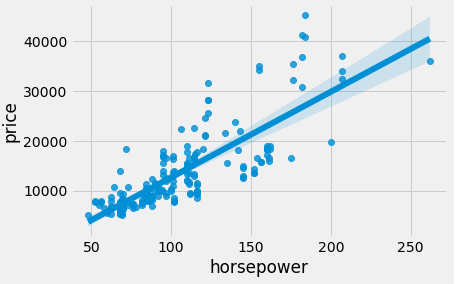
Through the seaborn library we make a quick linear regression plot to see how the cost increases in terms of horsepower with just one line of code.
ax = sns.regplot(x='horsepower', y='price', data=dff)
We make 2 functions so that we can quickly and easily make the graphs.
def DistributionPlot(RedFunction,BlueFunction,RedName,BlueName,Title ):

    width = 12

    height = 10

    plt.figure(figsize=(width, height))

    ax1 = sns.distplot(RedFunction, hist=False, color=”r”, label=RedName)

    ax2 = sns.distplot(BlueFunction, hist=False, color=”b”, label=BlueName, ax=ax1)

    plt.title(Title)

    plt.xlabel('Τιμή σε δολλάρια')

    plt.ylabel('Χαρακτηριστικά')

    plt.show()

    plt.close()

def PollyPlot(xtrain,xtest,y_train,y_test,lr,poly_transform):

    width = 12

    height = 10

    plt.figure(figsize=(width, height))

    xmax=max([xtrain.values.max(),xtest.values.max()])

    xmin=min([xtrain.values.min(),xtest.values.min()])

    x=np.arange(xmin,xmax,0.1)

    plt.plot(xtrain,y_train,'ro',label='Training δεδομένα')

    plt.plot(xtest,y_test,'go',label='Test δεδομένα')

    plt.plot(x,lr.predict(poly_transform.fit_transform(x.reshape(-1,1))),label='Προβλεπόμενα')

    plt.ylim([-10000,60000])

    plt.ylabel('Price')

    plt.legend()
Split data into Train and Test
We divide the data into training and test with a percentage of 70-30.
X_train, X_test, y_train, y_test = train_test_split(X, y, test_size=0.3, random_state=0)

print("number of test samples :", X_test.shape[0])

print("number of training samples:",X_train.shape[0])
number of test samples : 62

number of training samples: 143
Grading the model
We define in a variable the class we will use and start the training with the data. Then with the score we see that the R^2 is 0.33 which shows that the line does not pass through most of the points.
lre = LinearRegression()

lre.fit(X_train[['horsepower']],y_train)

lre.score(X_test[['horsepower']],y_test)
0.3331272902078515Cross-validate
We can cross validate to score in the following way by dividing the data into 4 pieces and testing each one separately.
Rcross=cross_val_score(lre,X[['horsepower']], y,cv=4)

print("The mean of the folds are", Rcross.mean(),"and the standard deviation is" ,Rcross.std())
The mean of the folds are 0.4392710840512933 and the standard deviation is 0.16681254993011282Price prediction
Let's try to build a model that predicts the price from the characteristics of the car.
lre = LinearRegression()

lre.fit(X_train[['horsepower', 'AVG-mpg', 'diesel', 'gas']],y_train)

lre.score(X_test[['horsepower', 'AVG-mpg', 'diesel', 'gas']],y_test)
0.40859095219326313We define the predicted values as yhat.
yhat_train=lre.predict(X_train[['horsepower', 'AVG-mpg', 'diesel', 'gas']])

yhat_train[3:7]
array([[21400.06711013],
[ 9861.84714747],
[ 4442.33687254],
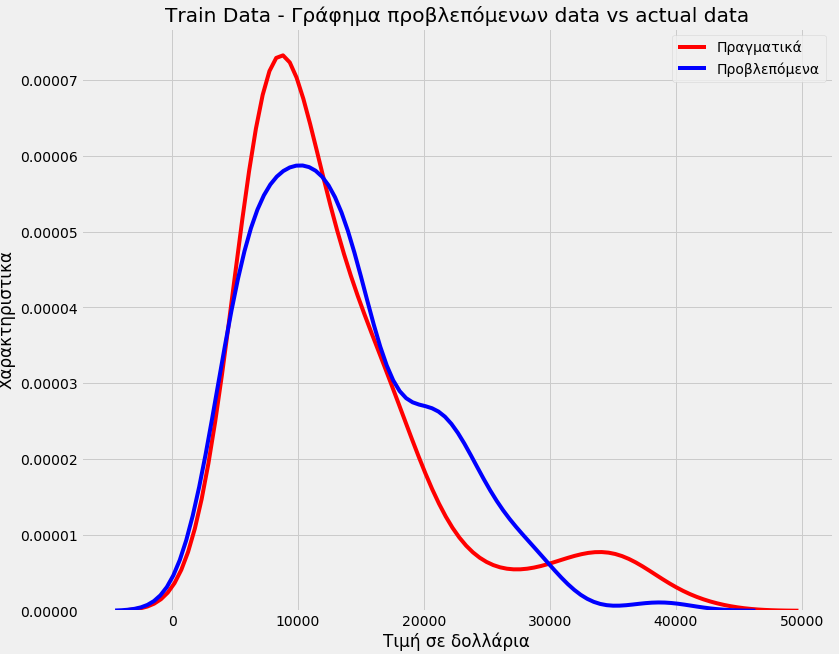
[ 5784.42153314]])We see that we did not have good accuracy in our model
The accuracy of the model
Title='Train Data – Γράφημα προβλεπόμενων data vs actual data'

DistributionPlot(y_train,yhat_train,"Πραγματικά","Προβλεπόμενα",Title)
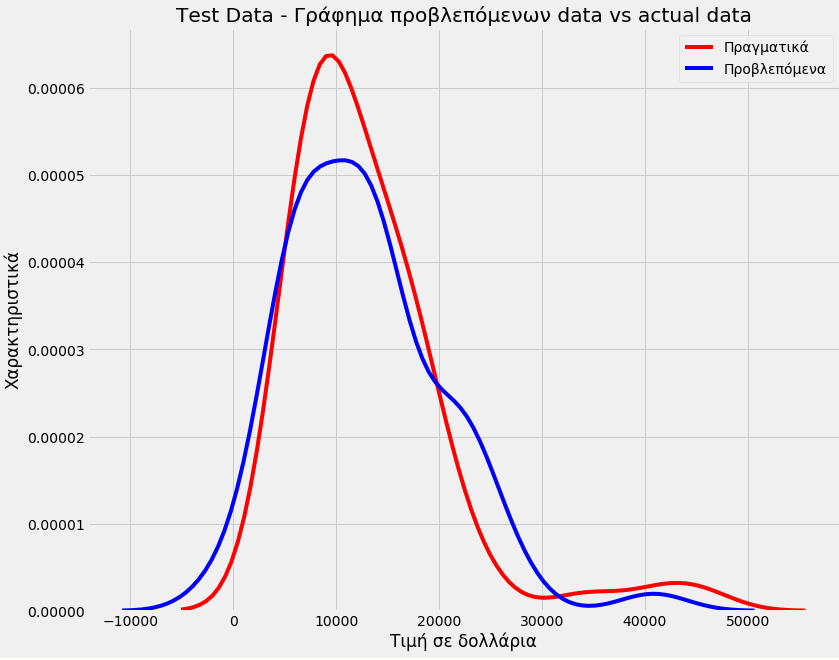
Title='Test Data – Γράφημα προβλεπόμενων data vs actual data'
DistributionPlot(y_test,yhat_test,"Πραγματικά","Προβλεπόμενα",Title)
Polynomial but what degree?
Let's go to polynomial of degree 5 and see if we can get something better. This time only with the horses.
pr=PolynomialFeatures(degree=5)

X_train_pr=pr.fit_transform(X_train[['horsepower']])

X_test_pr=pr.fit_transform(X_test[['horsepower']])

poly = LinearRegression()

poly.fit(X_train_pr, y_train)

LinearRegression(copy_X=True, fit_intercept=True, n_jobs=None, normalize=False)

yhat=poly.predict(X_test_pr)

print("Προβλεπόμενες τιμές:", yhat_test[0:4])

print("Πραγματικές τιμές:",y_test[0:4].values)
Προβλεπόμενες τιμές: [[ 5524.18191454]
 [21532.75818567]
 [14610.3150921 ]
 [ -995.04541995]]
Πραγματικές τιμές: [[ 6795.]
 [15750.]
 [15250.]
 [ 5151.]]
PollyPlot(X_train[['horsepower']],X_test[['horsepower']],y_train,y_test,poly,pr)
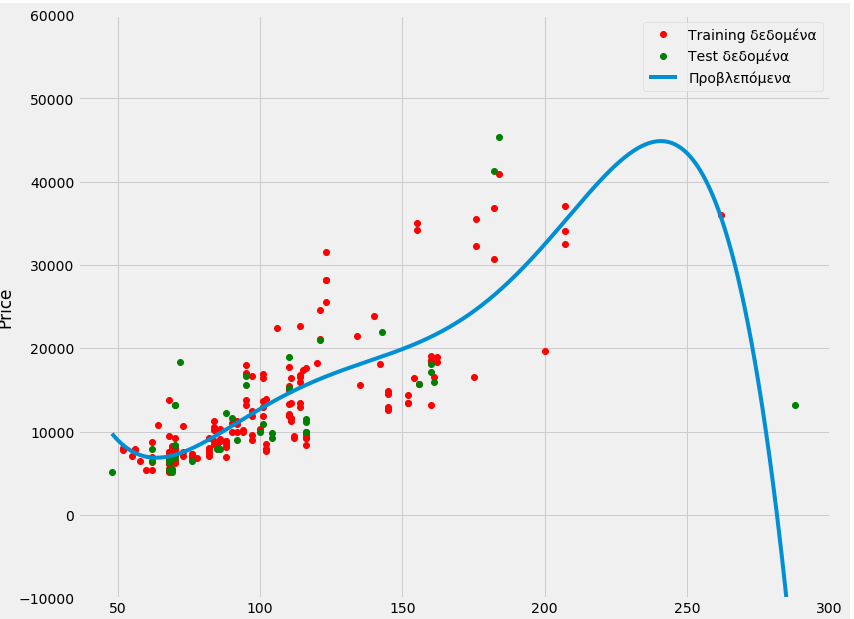
We see an improvement.
poly.score(X_train_pr,y_train)
0.6830658437904327poly.score(X_test_pr,y_test)
0.6830658437904327We can make a loop that tests the process with different degrees to choose the best one.
Rsqu_test=[]

order=[1,2,3,4]

for n in order:

    pr=PolynomialFeatures(degree=n)

    X_train_pr=pr.fit_transform(X_train[['horsepower']])

    X_test_pr=pr.fit_transform(X_test[['horsepower']])

    lre.fit(X_train_pr,y_train)

    Rsqu_test.append(lre.score(X_test_pr,y_test))

plt.plot(order,Rsqu_test)

plt.xlabel('order')

plt.ylabel('R^2')

plt.title('R^2 με χρήση Test Data')

plt.text(3, 0.75, 'Maximum R^2 ')
Text(3, 0.75, 'Maximum R^2 ')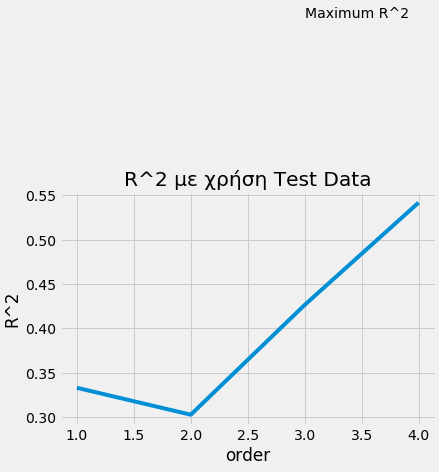
Ridge model
We also do a final test with the rigde model to see if we will have even better accuracy.
pr=PolynomialFeatures(degree=2)

X_train_pr=pr.fit_transform(X_train[['horsepower', 'AVG-mpg', 'diesel', 'gas']])

X_test_pr=pr.fit_transform(X_test[['horsepower', 'AVG-mpg', 'diesel', 'gas']])

RigeModel=Ridge(alpha=0.01)

RigeModel.fit(X_train_pr, y_train)

yhat=RigeModel.predict(X_test_pr)

print('predicted:', yhat[0:4])

print('test set :', y_test[0:4].values)
predicted: [[ 6807.95323245]
 [20468.43090602]
 [14849.82259996]
 [10178.31016628]]
test set : [[ 6795.]
 [15750.]
 [15250.]
 [ 5151.]]
Rsqu_test=[]
Rsqu_train=[]
dummy1=[]
ALFA=5000*np.array(range(0,2))
for alfa in ALFA:
RigeModel=Ridge(alpha=alfa)
RigeModel.fit(X_train_pr,y_train)
Rsqu_test.append(RigeModel.score(X_test_pr,y_test))
Rsqu_train.append(RigeModel.score(X_train_pr,y_train))
width = 12
height = 10
plt.figure(figsize=(width, height))
plt.plot(ALFA,Rsqu_test,label='validation data ')
plt.plot(ALFA,Rsqu_train,'r',label='training Data ')
plt.xlabel('alpha')
plt.ylabel('R^2')
plt.legend()
<matplotlib.legend.Legend at 0x7f32d8769358>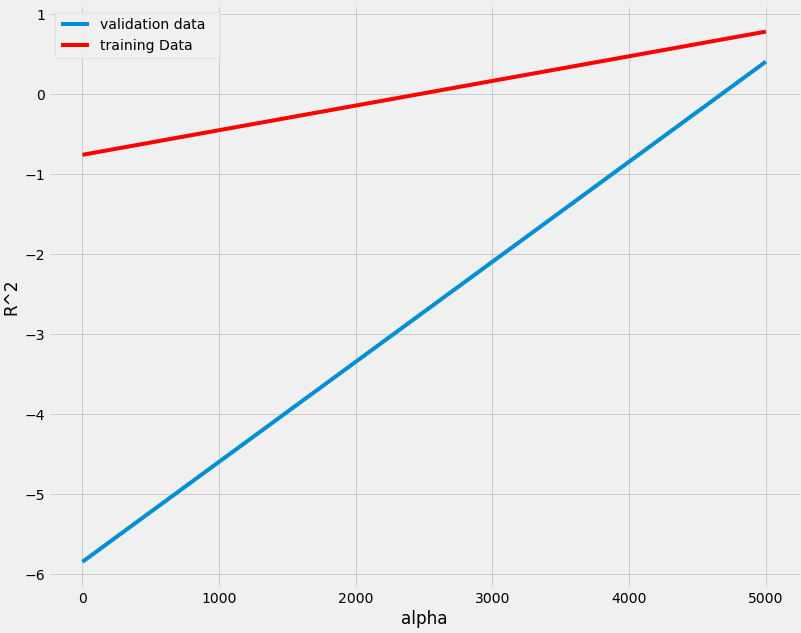
After a TLDR post I think you will get an idea.
They will certainly seem difficult and complex to you, but with use and experience, because the code required is only a few lines, their daily use will be easy.