

How to make our first graph using Python

Certifications:

In the article we will see how we can make graphs barplots with use Python easy and fast.
To begin with, we should load 3 libraries that we have ready with the functions we will need:
import pandas as pd #για τη δημιουργία dataframe
import matplotlib
import matplotlib.pyplot as plt #για το γράφημα
import numpy as np #για εύκολα math calculations
df = pd.read_csv('https://cocl.us/datascience_survey_data', index_col=0)
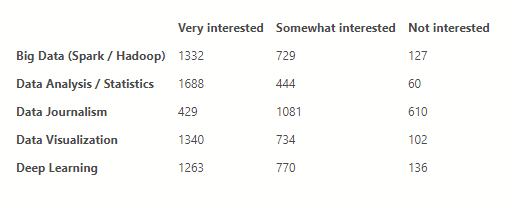
In the variable df we loaded one dataframe built using pandas with data from a public csv.
With .head() preview the first records of the dataframe:
df.head()
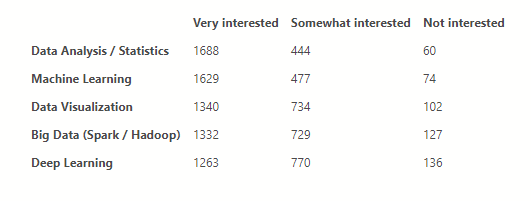
We can do them too sort:
df = df.sort_values('Very interested',axis=0, ascending=False)

df.head()
Now let's create the chart
We will need a new variable that will have the parameters of the graph, we will call it 'for' which will take as an argument the dataframe(df) and with .plot(kind='bar') we define it as a bar chart.
After defining what else we want, such as name, font size (legend is the box with the descriptions in the upper right graph) and colors.
By choice plt.show() will display it:
per = df.plot(kind='bar',
            figsize=(20, 8),
            width=0.8,
            color=['#5cb85c', '#5bc0de', '#d9534f'],
           )
per.set_title("Παράδειγμα bar plot", fontsize=16)
per.spines['left'].set_visible(False)
per.spines['top'].set_visible(False)
per.spines['right'].set_visible(False)
per.axes.get_yaxis().set_visible(False)
per.tick_params(labelsize=14)
per.legend(fontsize=14)

for p in per.patches:
    per.annotate(np.round(p.get_height(),decimals=2),
                (p.get_x()+p.get_width()/2., p.get_height()),
                ha='center',
                va='center',
                xytext=(0, 10),
                textcoords='offset points',
                fontsize = 14
               )

plt.show()
The result
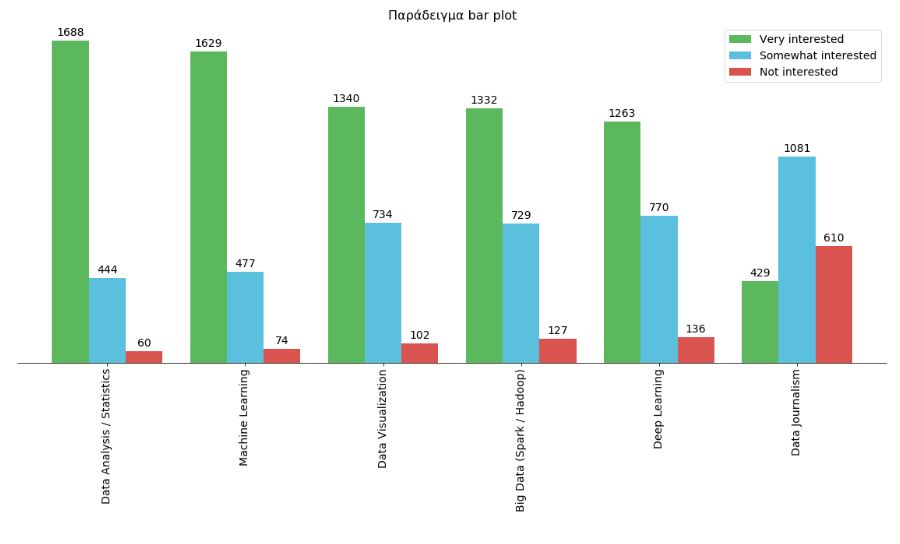
As an understanding at first it seems difficult but I think the result shows that it is worth the effort.
Taking the example as a guide you can experiment by playing with the parameters and you will see that it is easier than it first seems.