


How to do Performance Testing in PostgreSQL with pgbench


Certifications:

The pgbench is one of the most useful tools in PostgreSQL. It is used for benchmarking and stress testing the database, simulating multiple simultaneous transactions (TPS).
In this article we will see how we can set it up, run our first benchmarks, and utilize custom scripts for more realistic scenarios.
The installation
Before running any test, pgbench needs to create a standard number of tables. To do this, run the following command from the terminal after first logging in as the user postgres:
su postgres
pgbench -i -s 10 db_test
-i: Denotes the initialize command.-s 10: Sets the scale factor. A scale factor of 1 creates 100,000 rows in the base tables. 10 will create approximately 1 million rows in the table.pgbench_accounts, increasing the size of the base for more representative results.
After completion, we see four new tables: pgbench_accounts, pgbench_branches, pgbench_history, and pgbench_tellers.
Running the Standard Benchmark
Now that the database is ready, we can run a basic performance test. Let's say we want to test with 50 simultaneous clients (-c), using 2 threads (-j), for total time 60 seconds (-T):
pgbench -c 50 -j 2 -T 60 db_test
-c clients: The number of clients connected simultaneously.-j threads: The number of worker threads to be used in the operating system (it is good to match the available CPU cores).-T seconds: The duration of the test in seconds. Alternatively, instead of time, you can set a specific number of transactions per client with the parameter-t.
The results
After the test is finished, pgbench displays a report:
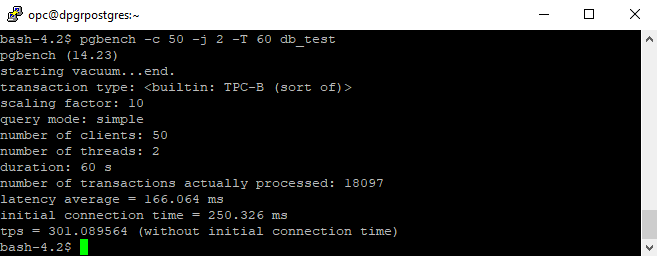
- TPS (Transactions Per Second): The most important performance indicator. It shows how many transactions were completed per second.
- Latency Average: The average time it took to complete a transaction.
Using Custom Scripts
The standard benchmark is good for general CPU and I/O tests but rarely fits the queries of our own application exactly, the pgbench allows us to run our own custom sql scripts.
Create a file, e.g. custom_workload.sql:
\set aid random(1, 100000 * 10)
SELECT abalance FROM pgbench_accounts WHERE aid = :aid;
Run the benchmark using your file with the parameter -f:
pgbench -c 20 -T 30 -f custom_workload.sql db_test
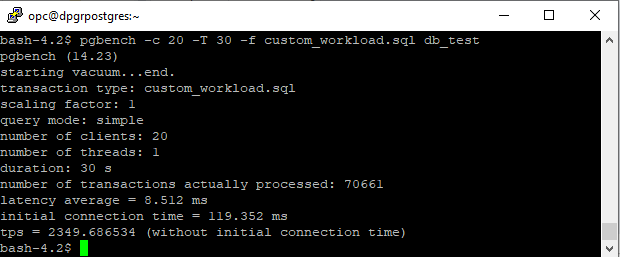
In conclusion, let us say that the pgbench is an extremely lightweight and powerful tool. It allows us to quickly measure the performance of our infrastructure, test changes to postgresql.conf such as shared_buffers, effective_cache_size, work_mem and evaluate the database's behavior under pressure before moving to production environments.