How do we find what's slowing down queries in SQL Server?

The journey began in 2008 where I officially started working in the field of IT (IT). Starting the first semester of school I realized a special attraction towards databases and automation. I have been involved with databases such as Microsoft SQL Server / Oracle Database, data analysis and automations using the command line (CLI), Visual Basic for Applications and Python. Through years of experience I have developed these capabilities so that I can make my life easier. For me, the purpose of every IT guy and every office worker is to have the knowledge so that through tools he can work a little but produce a lot. Through this his website DataPlatform.gr I try to offer knowledge and propose solutions to everyday problems.
Certifications:

Certifications:
Latest posts by Stratos Matzouranis (see all)
Many times we will see that a query is delayed and we would like to know what is delaying it. To do this we need to know the wait types and what each of them means.
Specifically types they can show what delays a query during execution. Similarly, high waits in time and number can be seen aggregated and at the instance level.
There is a detailed list of all wait types here.
The most common wait types
- SOS_SCHEDULER_YIELD: indicates high CPU usage. It may be due to the use of intensive CPU tasks such as recompiling footage.
- CXPACKET: this wait is due to waiting for all parallel threads to complete. It is created as each thread receives a non-proportional weight for completing each other's work. The solution to the problem may be to increase it cost threshold of parallelism.
- WRITELOG: shows transaction log I/O latency. Moving the transaction logs to different fast disks can reduce this.
- LCK_M_IX: happens when there is a lock on the table or its page from an insert or update, it may be due to the lack of an index or the fact that it is fragmented.
- LCK_M_X: indicates that there is a delay due to row locks. It may be due to the use of a limiter isolation level.
- ASYNC_NETWORK_IO: indicates that there is a delay from SQL Server waiting for the client to finish processing the data.
- PAGEIOLATCH_SH: shows the delay in loading pages from disk into memory. It may be due to a reduced RAM memory that leads to not being able to hold a large number of pages, but it may also be due to low I/O on the physical disks.
- PAGELATCH_EX: usually due to multiple consecutive inserts with identity in the primary key. It may also indicate that they don't have enough database files in tempdb.
- RESOURCE_SEMAPHORE: occurs when a query is waiting to allocate the necessary memory (memory grant) to start its execution. This wait type is particularly critical, as it indicates that the instance has run out of available memory to execute new tasks. It is usually due to very large queries that require huge memory grants (e.g. due to large sorts or hashes) or to incorrect estimates of the optimizer (cardinality estimation) that lead to excessive resource allocations. The solution may include optimizing the queries to consume less memory, creating appropriate indexes, or even increasing the physical RAM of the server.
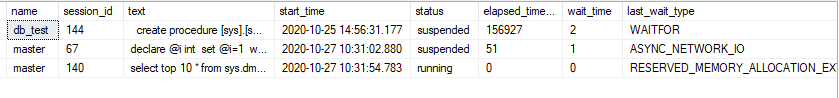
How do we find what is delaying a specific query?
When a query is executed we can through the dynamic view sys.dm_exec_requests let's find it last_wait_type so we can see what seems to be delaying the query at the moment.
SELECT d.name,p.command,p.session_id,t.text,p.start_time,p.status,p.total_elapsed_time/1000 as elapsed_time_secs,wait_time/1000 as wait_time,last_wait_type,p.blocking_session_id,m.granted_memory_kb,m.grant_time,p.plan_handle,ph.query_plan,p.sql_handle,dr.host_name,dr.program_name,dr.login_name
FROM sys.dm_exec_requests p
inner join sys.databases d on d.database_id = p.database_id
outer apply sys.dm_exec_sql_text(p.sql_handle) t
outer apply sys.dm_exec_query_plan(p.plan_handle) as ph
inner join sys.dm_exec_sessions dr on dr.session_id = p.session_id
left join sys.dm_exec_query_memory_grants m on m.session_id = p.session_id
where 1=1
and text is not null
--and p.session_id in (select spid from sysprocesses where blocked<>0) --find blocked only
order by  p.start_time
Wait statistics on the entire instance
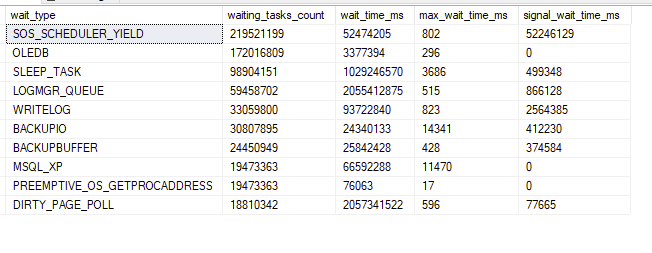
However, we can also see the total top 10 waits that the SQL Server instance had since the last time it was restarted or DBCC SQLPERF('sys.dm_os_wait_stats', CLEAR):
select top 10 * from sys.dm_os_wait_stats
order by  wait_time_ms desc