

How do we find what queries are running in an Oracle database?

Certifications:

Many times the need will arise to quickly look for a session that executes a query. We might want to see the plan it ran with, the memory it consumes, the sql text, the session id, if it has an uncommitted transaction, the undo it binds, who it ran from, if you block, the command to kill it, etc. .l.
In this need, I created the query that we will see that combines information from various systemic views.
Putting or removing in where the comment “–” we can change the criteria we are looking for such as sql id, sid, sql text etc.
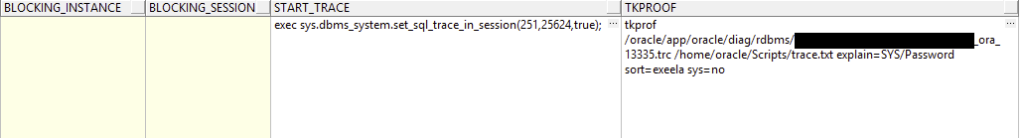
We also have the ability to start trace in this session and see the trace information through a ready command at tkproof (in this command we will then need to put the corresponding password).
But be careful in the field where we read the trace for tkproof, the information comes from the view diag_info which exists from version 11 onwards, in case we want to run in an older version, we comment this field.
The query for the current sessions
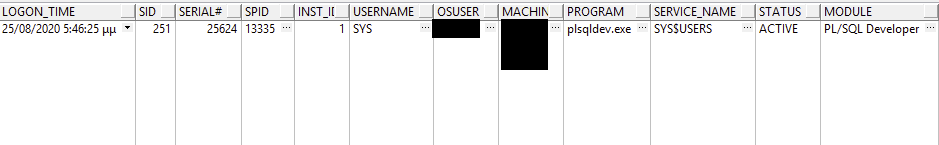
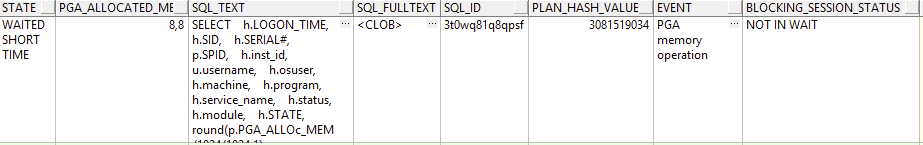
With the following query we can find the information from any session that exists at the moment.
SELECT
   h.LOGON_TIME,
   h.SID,
   h.SERIAL#,
   p.SPID,
   h.inst_id,
   u.username,
   h.osuser,
   h.machine,
   h.program,
   h.service_name,
   h.status,
   h.module,
   h.STATE,
   s.sql_text,
   s.SQL_FULLTEXT,
   h.sql_id,
   z.PLAN_HASH_VALUE,
   h.event,
   h.blocking_session_status,
   h.blocking_instance,
   h.blocking_session,
   round(s.sharable_mem/1024/1024,1) SHARABLE_MEM_MB,
   round(s.persistent_mem/1024/1024,1) PERSISTENT_MEM_MB,
   round(s.runtime_mem/1024/1024,1) RUNTIME_MEM_MB,
   round(p.PGA_ALLOc_MEM/1024/1024,1) PGA_ALLOCATED_MB,
   (case tr.status when 'ACTIVE' then 'True' else '' end) as Is_Uncommited,
   round(tr.used_ublk * (select block_size from dba_tablespaces where tablespace_name= 'UNDOTBS1') / (1024*1024),2) as UNDO_SIZE_MB
   ,t.tablespace as Temp_Tablespace
  , round (((t.blocks * 8192) / 1024 / 1024 / 1024), 2) as Temp_Size_GB
   ,'exec sys.dbms_system.set_sql_trace_in_session(' ||h.SID||','||h.SERIAL#||',true);' as start_trace
   ,'tkprof ' ||  (select pap.value from gv$diag_info pap WHERE pap.name = 'Diag Trace' and  pap.inst_id = h.inst_id  ) || '/' || LOWER(SYS_CONTEXT('userenv','instance_name')) ||   '_ora_' || p.spid || '.trc'  || ' /home/oracle/Scripts/trace.txt explain='||u.username||'/Password sort=exeela sys=no' as TKPROOF
   ,h.failover_type
   ,h.failover_method
   ,'alter system kill session '''||sid||', '||h.serial#||', @'||h.inst_id||''' immediate;' KILL_CMD
   ,'kill -9 '||p.spid kill_spid
FROM
   gv$session h
LEFT JOIN gv$SQLAREA s ON h.sql_hash_value = s.hash_value and h.sql_ADDRESS = s.ADDRESS and h.inst_id = s.inst_id
LEFT JOIN (select PLAN_HASH_VALUE,SQL_ID,MAX(TIMESTAMP) from gv$sql_plan GROUP BY PLAN_HASH_VALUE,SQL_ID ORDER BY PLAN_HASH_VALUE DESC,MAX(TIMESTAMP) DESC) z ON h.SQL_ID = z.SQL_ID
LEFT JOIN DBA_USERS u ON h.USER# = u.USER_ID
LEFT JOIN gv$process  p ON p.ADDR = h.PADDR and p.inst_id = h.inst_id
LEFT JOIN gv$transaction tr ON tr.SES_ADDR = h.SADDR and tr.inst_id = h.inst_id
LEFT JOIN gv$sort_usage t on h.saddr = t.session_addr
WHERE  1=1
and h.sid != (select sys_context('USERENV','SID') from dual)
and h.status = 'ACTIVE'
and h.service_name != 'SYS$BACKGROUND'
--and h.SID = 4533
--and s.sql_id = 'av7nawu9dw14a'
--and s.sql_text LIKE '%session%'
--and h.OSUSER LIKE '%app%'
--and h.blocking_session_status = 'VALID'
--and u.username LIKE '%SYS%'
ORDER BY h.LOGON_TIME DESC
/
The result
In case the query was executed a few hours ago, we should look for it in the history view ACTIVE_SESSION_HISTORY (ASH).
The query for old sessions
In order to be able to find the corresponding information, we should combine historical views with the central information being in active_session_history (ASH) which we mentioned before.
Information corresponding to it is recorded there gv$session of the active sessions and saves a record for the image that each session had then in each second (sample_time).
select
  a.inst_id,
  a.sample_time,
  a.session_id,
  a.session_serial#,
  u.username,
  a.user_id,
  a.sql_id,
  s.sql_text,
  p.PLAN_HASH_VALUE,
  a.module,
  a.machine,
  a.blocking_session_status,
  a.blocking_session,
  a.blocking_session_serial#,
  round(a.temp_space_allocated/1024/1024/1024) temp_usage_in_gb
from GV$ACTIVE_SESSION_HISTORY a
LEFT JOIN DBA_USERS u ON a.USER_ID = u.USER_ID
LEFT JOIN dba_hist_sqltext s ON a.sql_id = s.sql_id
LEFT JOIN (select distinct PLAN_HASH_VALUE,SQL_ID, TO_CHAR(TIMESTAMP, 'DD-MM-YY HH') as Timin from dba_hist_sql_plan)p ON a.sql_id = p.sql_id and p.Timin = TO_CHAR(a.sample_time, 'DD-MM-YY HH')
where 1=1
--and s.sql_text like '%FROM CUSTOMER%'
--and a.session_id = 4570 --switch it
--and a.session_serial# = 24864 --switch it
--and u.username LIKE '%SYS%'
--and a.temp_space_allocated/1024/1024/1024 > 3
order by a.sample_time DESC
/