

What is Query Store and how we use it in SQL Server

Certifications:

The Query Store appeared from the release SQL Server 2016 and then. It is a tool provided so that we can track each query (query) to the database.
Through the Query Store we can see a query, when it was executed, its duration, the execution plan which he used and many others.
Let's remember what the execution plan is
The execution plan is essentially a map that you create from the RDBMS query optimizer taking into account the statistics/cardinality to find the optimal way to pass the data for the process we have asked it to do.
Through Query Store we can see it execution plan (plan) that existed every time each query was executed over time and to identify when the plan changed. It enables us to do force the plan so that the optimizer does not choose but we declare that we want the specific one.
Very useful features are also the ability to see which queries are the most expensive, the history of each query, how many times the query was executed in a certain period of time and when the performance of a query dropped due to a change of plan.
How to enable and configure with T-SQL
To activate it, simply run the command:
ALTER DATABASE [partition] SET QUERY_STORE = ON;
With the OPERATION_MODE we define whether in the Query Store we will only be able to read data READ_ONLY or that it will be updated with new ones READ_WRITE:
ALTER DATABASE [partition]
SET QUERY_STORE (OPERATION_MODE = READ_WRITE);
The MAX_STORAGE_SIZE_MB is the query store data size limit. In a production environment the value must be above 2048 MB, but the value must also be proportional to the number of days in case we set the number of days STALE_QUERY_THRESHOLD_DAYS in 90 days e.g. it is recommended to use 8192 MB and accordingly current_storage_usage in the sys.database_query_store_options:
ALTER DATABASE [partition]
SET QUERY_STORE (MAX_STORAGE_SIZE_MB = 1024);
With the parameter SIZE_BASED_CLEANUP_MODE = AUTO when Query Store data approaches the maximum size the oldest will be deleted. Otherwise case defined as OFF the operation mode changes to read-only, as a result of which the collection of new data is stopped:
ALTER DATABASE [partition]
SET QUERY_STORE (SIZE_BASED_CLEANUP_MODE = AUTO);
With the parameter CLEANUP_POLICY we define for how many days the data will be kept. The higher the value, the more disk space it will consume:
ALTER DATABASE [partition]

SET QUERY_STORE (CLEANUP_POLICY = (STALE_QUERY_THRESHOLD_DAYS = 30));
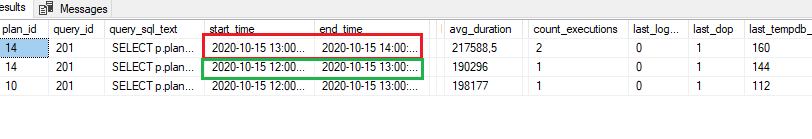
The Interval Length Minutes determines every time the query statistics (duration, tempdb_usage, memory_usage, count executions, etc.) will be aggregated (average, sum ...) in a different record in the table sys.query_store_runtime_stats . The smaller the value, the more information we have over time, but at the same time the data on the disk increases:
*Caution this parameter can only take specific values (1, 5, 10, 15, 30, 60, 1440)
ALTER DATABASE [partition]

SET QUERY_STORE (INTERVAL_LENGTH_MINUTES = 60);
That data flush interval is the time in seconds that query store statistics are written from memory to disk. In case of memory pressure, this parameter is automatically ignored and the data on the disk is flushed at that moment. As long as this data has not been flushed, it will not be visible in the dynamic views of the Query Store. Suggested value of 900 seconds (15 minutes):
ALTER DATABASE [partition]

SET QUERY_STORE (DATA_FLUSH_INTERVAL_SECONDS = 900);
With the parameter ALL in the QUERY_CAPTURE_MODE we define to record all the queries that are executed. With the parameter AUTO only those queries that have been executed many times or have a long duration will be recorded. With the parameter NONE the statistics will be updated only for those queries that have already been recorded:
ALTER DATABASE [partition]

SET QUERY_STORE (QUERY_CAPTURE_MODE = ALL);
To SQL Server 2019 we also have the choice CUSTOM where we can define multiple criteria, e.g.:
ALTER DATABASE [partition]  SET QUERY_CAPTURE_POLICY = (
        STALE_CAPTURE_POLICY_THRESHOLD = 24 HOURS,
        EXECUTION_COUNT = 30,
        TOTAL_COMPILE_CPU_TIME_MS = 1000,
        TOTAL_EXECUTION_CPU_TIME_MS = 100
      );
Also in SQL Server 2017 / 2019 we have the possibility to define whether the wait statistics will also be recorded with the parameter WAIT_STATS_CAPTURE_MODE which default is ON:
ALTER DATABASE [partition]
SET QUERY_STORE (WAIT_STATS_CAPTURE_MODE = ON);
Done with the parameter MAX_PLANS_PER_QUERY we define the maximum number of shots per query. The value 200 is the default and we recommend leaving it as is:
ALTER DATABASE [partition]
SET QUERY_STORE (MAX_PLANS_PER_QUERY = 200);
Query Store Activation Example for SQL Server 2019
ALTER DATABASE [partition]

SET QUERY_STORE = ON
    (
      OPERATION_MODE = READ_WRITE,
      CLEANUP_POLICY = ( STALE_QUERY_THRESHOLD_DAYS = 90 ),
      DATA_FLUSH_INTERVAL_SECONDS = 900,
      MAX_STORAGE_SIZE_MB = 2048,
      INTERVAL_LENGTH_MINUTES = 60,
      SIZE_BASED_CLEANUP_MODE = AUTO,
      MAX_PLANS_PER_QUERY = 200,
      WAIT_STATS_CAPTURE_MODE = ON,
      QUERY_CAPTURE_MODE = CUSTOM,
      QUERY_CAPTURE_POLICY = (
        STALE_CAPTURE_POLICY_THRESHOLD = 24 HOURS,
        EXECUTION_COUNT = 30,
        TOTAL_COMPILE_CPU_TIME_MS = 1000,
        TOTAL_EXECUTION_CPU_TIME_MS = 100
      )
   );
How we check the good operation of the Query Store
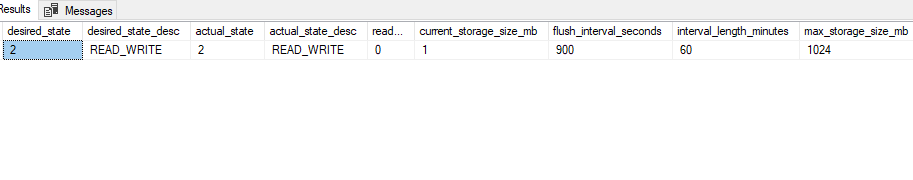
To check the status, the space used and the parameters of the query store:
select * from sys.database_query_store_options;
To clear the space of all data taking up space:
ALTER DATABASE [partition] SET QUERY_STORE CLEAR;
If the query store stops working, we can do a check with the procedure:
exec sp_query_store_consistency_check;
To disable the Query Store hard way which, however, has the effect of not writing the data that is in memory to the disk:
ALTER DATABASE [partition] SET QUERY_STORE = OFF (FORCED);
In editions before SQL Server 2019 should be enabled trace flag 7745. Its function is in the event of a shutdown or failover not to wait to write all the Query Store data that is in memory to the disk. Otherwise the Query Store would delay the restart of the instance.
Extracting useful information with T-SQL
The query I made that makes our life easier...
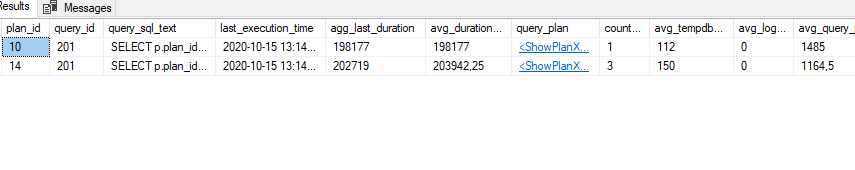
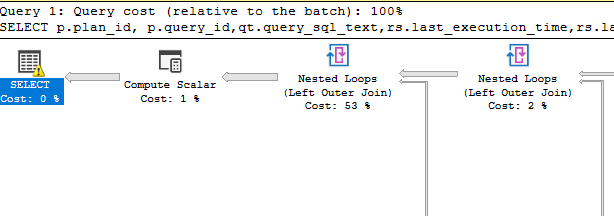
We can do aggregate the data so that we can see for each plan that ran a query a comparison between them last interval and his total, average of the statistics (run time, memory usage, tempdb, log usage, etc.). We can also see the full graphic of the shot:
SELECT p.plan_id, p.query_id,qt.query_sql_text
,case when q.object_id = 0 then 'ad_hoc' else OBJECT_NAME(q.object_id) end as object_name
,DATEADD(HOUR,DATEDIFF(hour,  SYSUTCDATETIME(),SYSDATETIME() ),q.last_execution_time) as last_execution_time
,ad.last_duration as agg_last_duration
,ad.avg_duration_aggregate
,cast(p.query_plan as xml) query_plan
,ad.count_executions
,ad.avg_tempdb_space_used
,ad.avg_log_bytes_used
,ad.avg_query_max_used_memory
,ad.max_dop
FROM sys.query_store_query AS q
inner JOIN sys.query_store_plan AS p on p.query_id = q.query_id
inner JOIN sys.query_store_query_text AS qt on q.query_text_id = qt.query_text_id
inner JOIN (select plan_id,avg(last_duration)as last_duration,avg(avg_duration)as avg_duration_aggregate,sum(count_executions) as count_executions, avg(avg_query_max_used_memory) as avg_query_max_used_memory,  avg(avg_tempdb_space_used) as avg_tempdb_space_used,avg(avg_log_bytes_used) as avg_log_bytes_used,max(max_dop) max_dop  from sys.query_store_runtime_stats group by plan_id ) as ad on ad.plan_id = p.plan_id
WHERE 1=1
--and p.is_forced_plan = 1
--and  p.query_id = 201
--and  qt.query_sql_text like '%SELECT p.plan_id%'
order by q.last_execution_time,q.query_id desc;
*dateadd is needed because SQL Server normally brings the dates in UTC time zone.
**The cast to query_plan is needed so that when we click on the plan, the graphic opens.
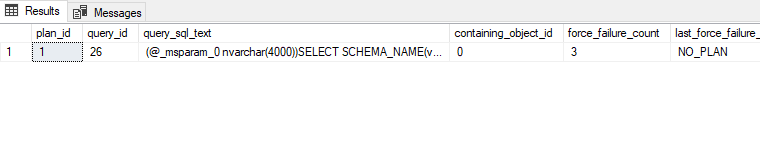
To see which shots are forced and the reason they may have failed to be made
SELECT p.plan_id, p.query_id, qt.query_sql_text,q.object_id as containing_object_id,
    force_failure_count, last_force_failure_reason_desc
FROM sys.query_store_plan AS p
inner JOIN sys.query_store_query AS q on p.query_id = q.query_id
inner JOIN sys.query_store_query_text AS qt on q.query_text_id = qt.query_text_id
WHERE is_forced_plan = 1;
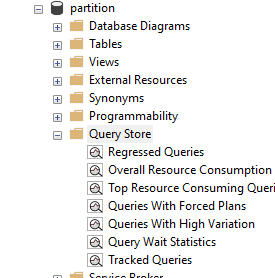
The information we see with the Query Store GUI
The convenience that Query Store provides us is the extensive use of a graphical environment. Let's take a detailed look at the screens it provides:
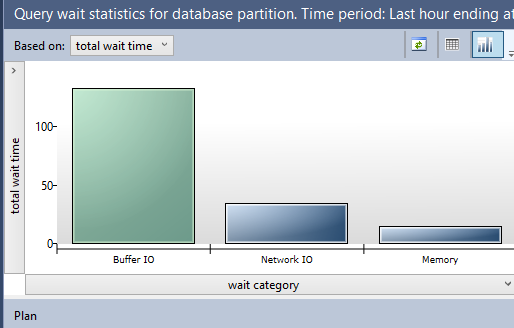
Query wait statistics:
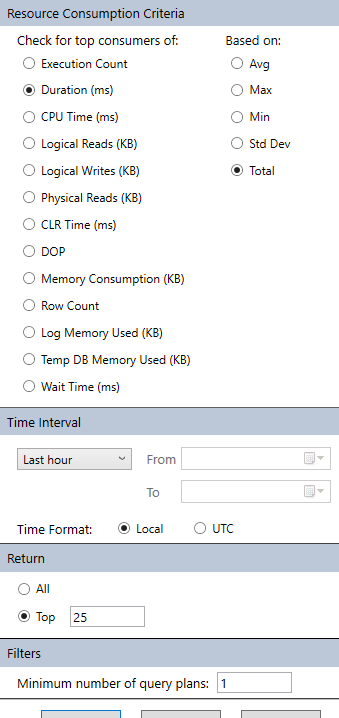
The queries that consumed the most resources:
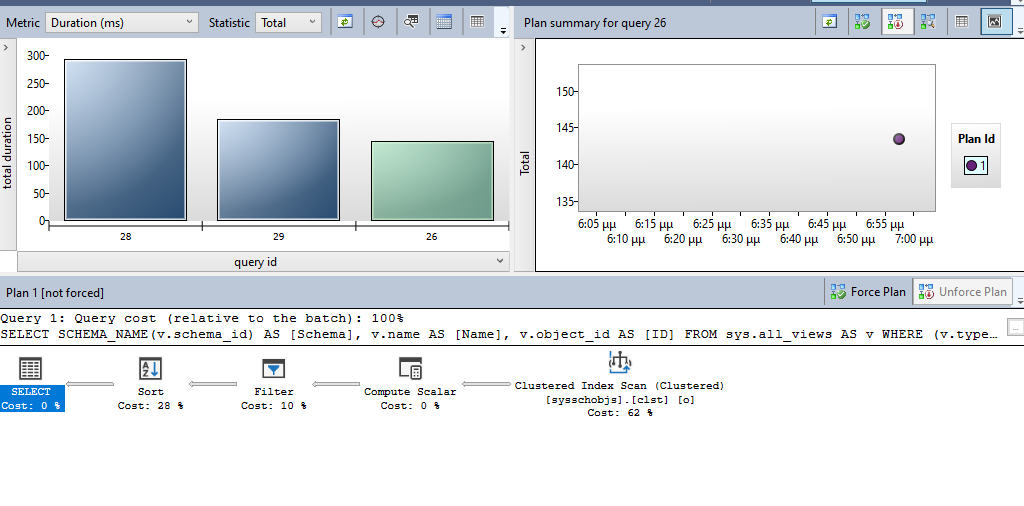
We can customize the data we see and change the filters:
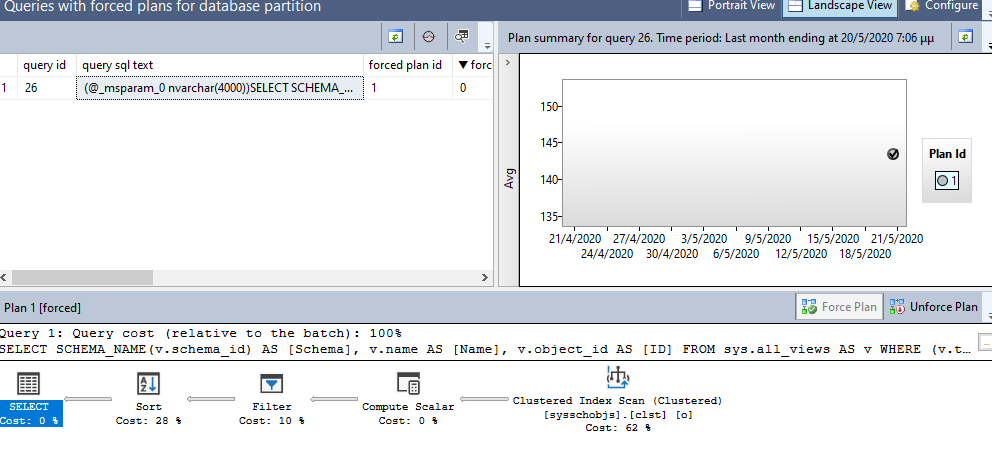
We can see the queries that are forced, the plan and the changes made to the plan over time.
When we select a query from the query report it shows us all the shots that have changed over time. By selecting the button "Force Plan" we declare that from now on we want it to always run with the specific plan.
In closing, we should not forget that like every extra function we add to a server, so too Query Store in SQL Server it comes with one overhead, which will reduce performance even to a small degree.
We can change the parameters according to the problem we face in each case. It may still not be beneficial for our system to activate it at all and instead to activate the corresponding Extended Event (from SQL Server 2017 CU 14 version onwards).
We will see how this is done in the next article...!
Good Evening ,
According to his executor
“SELECT p.plan_id, p.query_id,qt.query_sql_text
,case when q.object_id = 0 then 'ad_hoc' else OBJECT_NAME(q.object_id) end as object_name
,DATEADD(HOUR,DATEDIFF(hour, SYSUTCDATETIME(),SYSDATETIME() ),q.last_execution_time) as last_execution_time
,ad.last_duration as agg_last_duration….”
I get the following error : XML datatype instance has too many levels of nested nodes. Maximum allowed depth is 128 levels.
There is a possibility to increase it – SQL 2017
Try not to convert the plan field to xml:
cast(p.query_plan as xml) query_plan
Changed to plain:
p.query_plan
However, when you click on the plan, it will not show you graphically. To see it graphically you have two ways.
Copy the query_plan you want (ShowPlanXML...) and paste:
– either on the site
https://www.brentozar.com/pastetheplan/
– either you save it in another file with the extension .sqlplan and open it again with Sql server management studio.