How can we see what CPU Usage we had per minute in SQL Server

The journey began in 2008 where I officially started working in the field of IT (IT). Starting the first semester of school I realized a special attraction towards databases and automation. I have been involved with databases such as Microsoft SQL Server / Oracle Database, data analysis and automations using the command line (CLI), Visual Basic for Applications and Python. Through years of experience I have developed these capabilities so that I can make my life easier. For me, the purpose of every IT guy and every office worker is to have the knowledge so that through tools he can work a little but produce a lot. Through this his website DataPlatform.gr I try to offer knowledge and propose solutions to everyday problems.
Certifications:

Certifications:
Latest posts by Stratos Matzouranis (see all)
SQL Server upon installation creates a lightweight Extended Event with a size of up to 5mb in which it records performance information. This Extended Event is called system_health and in this article we will see how we can with a simple query see what CPU Usage we had on the server per minute.
But we must not forget that the information is made rollover and overlap with new data. So the amount of time we can see in the past is not very long.
The code
All we need to do is to run the following code in a query window:
SELECT time,100-record.value('(./Record/SchedulerMonitorEvent/SystemHealth/SystemIdle)[1]', 'INT') as 'Cpu Usage %'
          FROM (
                SELECT CONVERT(xml, record) AS [record],dateadd (ms,timestamp - (select ms_ticks from sys.dm_os_sys_info),getdate()) as 'Time'
				FROM sys.dm_os_ring_buffers
                WHERE ring_buffer_type = N'RING_BUFFER_SCHEDULER_MONITOR'
                AND record LIKE '%<SystemHealth>%'
			    order by time desc) AS x
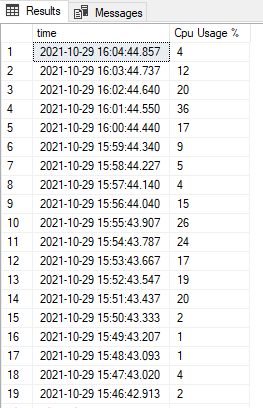
The result that will return to us is the CPU Usage we had per minute: