How do we find how much more it takes to complete the query and which is delayed (SQL Server Query Profiling)
Certifications:

Many times we will encounter queries that take too long to complete or never complete at all. To find out what exactly is at fault the most useful information is the actual execution plan.
As the actual execution plan requires the completion of the query, with the live query statistics provide the ability for real-time information as you run the query. Information such as which query of the batch we are in, the number of records produced, execution time, CPU - I/O usage, the progress of the query and finally in which execution plan operator we are here to complete the process.
How can we monitor a specific query that we want to run
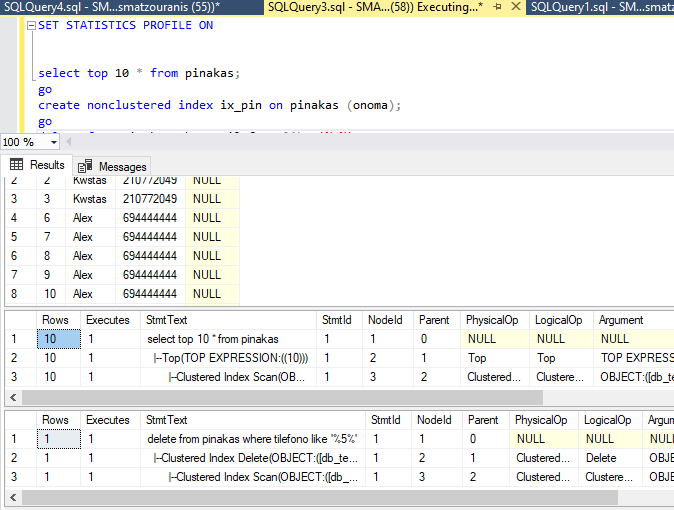
By writing the command before the query SET STATISTICS PROFILE ON when we run the batch in addition to the results we will be shown the actual execution plan per query.
SET STATISTICS PROFILE ON


select top 10 * from pinakas;
go

create nonclustered index ix_pin on pinakas (onoma);
go

delete from pinakas where tilefono like '%5%'
go

declare
@i int;
set @i =1;
while @i<100000
begin
insert into pinakas values ('stratos'+cast(@i as varchar),'20294012',null)
set @i=@i+1
end
At the same time, this information about the progress of the query (which has the statistics profile activated) is recorded in the dynamic view sys.dm_exec_query_profiles. At the same time we can see the live execution plan in the sys.dm_exec_query_Statistics_xml.
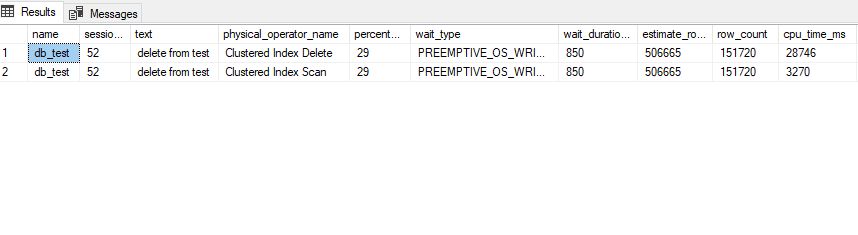
So by running it we see in which query and operator the batch is currently available. We also see it completion rate, the wait type and the live execution plan of.
select d.name,qp.session_id,text,physical_operator_name,(row_count*100/nullif(estimate_row_count,0)) as percent_complete,w.wait_type,w.wait_duration_ms,lp.query_plan as live_query_plan,p.query_plan,row_count,estimate_row_count,cpu_time_ms,logical_read_count,physical_read_count,write_page_count,qp.object_id,object_name(qp.object_id) as object_name,qp.index_id
,i.name as index_name
from sys.dm_exec_query_profiles qp
left join sys.dm_os_waiting_tasks w on w.session_id = qp.session_id
left join sys.databases d on d.database_id = qp.database_id
left join sys.indexes i on qp.object_id=i.object_id and qp.index_id = i.index_id
outer apply sys.dm_exec_sql_text(qp.sql_handle) as t
outer apply sys.dm_exec_query_plan(qp.plan_handle) as p
outer apply sys.dm_exec_query_Statistics_xml(qp.plan_handle) as lp
where text not like '%dm_exec_query_profiles%'
How to enable Live Query Statistics
Beyond choosing to turn it on statistics profile if we are using SQL Server Management Studio 2016 and later, we have the option to enable both Live Query Statistics.
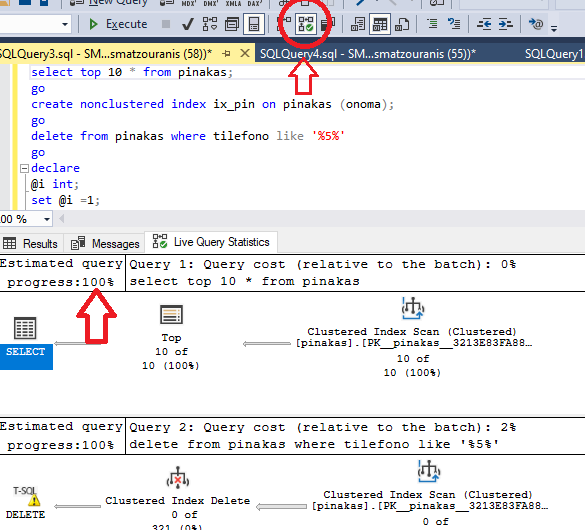
Simple by selecting its button before executing the specific query Include Live Query Statistics (as shown in the image below).
During the execution of the query we will see the query progress per batch and the progress of each query plan operator within it.
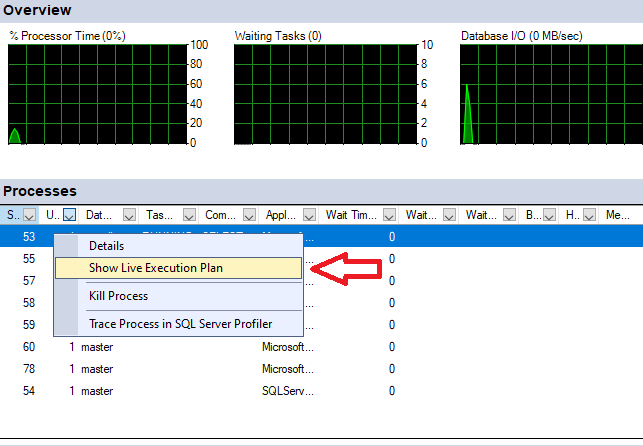
Also if we right click on Activity Monitor of Management Studio we will see the option Show Live Execution Plan for which only queries the command is used SET STATISTICS PROFILE ON.
How do we enable these functions across the instance?
Its use profiling has always been a function with a large performance impact so we activate it for a certain period of time on selected bases.
Since SQL Server 2016 (although officially it was from SQL Server 2014 SP2 using XEvent) introduced the lightweight query profiling. It is a lighter profiling that does not record CPU usage but collects all other information.
Thanks to lightweight query profiling, we can have profiling enabled permanently on the entire instance.
How to enable lightweight query profiling
To SQL Server 2016 we can enable trace flag 7412 so that it is enabled on the entire instance.
DBCC TRACEON (7412, -1);
Alternatively we can activate it if it is not at the instance level at the query only level with query hint.
select * from pinakas option ( use hint ( 'QUERY_PLAN_PROFILE' ));
In order for it to work, XEvent must exist and has been created query_plan_profile.
CREATE EVENT SESSION query_plan_profile
    ON SERVER
    ADD EVENT sqlserver.query_plan_profile
    ( SET collect_database_name = ( 0 )
     ACTION ( sqlserver.plan_handle,
              sqlserver.query_hash_signed,
              sqlserver.query_plan_hash_signed,
              sqlserver.sql_text )
              )
    ADD TARGET package0.event_file
    ( SET filename = N'c:\xevents\query_plan_profile' )
    WITH ( MAX_MEMORY = 4096KB,
           EVENT_RETENTION_MODE = ALLOW_SINGLE_EVENT_LOSS,
           MAX_DISPATCH_LATENCY = 5 SECONDS,
           MAX_EVENT_SIZE = 0KB,
           MEMORY_PARTITION_MODE = NONE,
           TRACK_CAUSALITY = OFF,
           STARTUP_STATE = OFF );
GO

ALTER EVENT SESSION query_plan_profile ON SERVER STATE = START;
GO
What's changing in SQL Server 2019
From SQL Server 2019 on lightweight query profiling is enabled at the instance level by default (no trace flag needed).
There is the command to enable or disable at database level.
ALTER DATABASE SCOPED CONFIGURATION SET LIGHTWEIGHT_QUERY_PROFILING = ON
We also have the ability to find the last actual execution plan of the queries that are still blocked.
To enable it we run at base level:
ALTER DATABASE SCOPED CONFIGURATION SET LAST_QUERY_PLAN_STATS = ON;
To see the results simply having only the sql text:
SELECT size_in_bytes,cacheobjtype,objtype,text,query_plan FROM sys.dm_exec_cached_plans AS cp
CROSS APPLY sys.dm_exec_sql_text(plan_handle) AS st
CROSS APPLY sys.dm_exec_query_plan_stats(plan_handle) AS qps
WHERE st.text LIKE '%test%';
GO
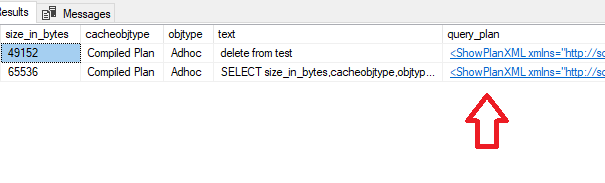
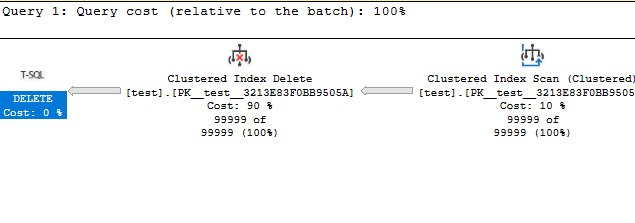
Selecting the hyperlink in each one will open the graphic from the plan it had.
Also in SQL Server 2019 / SQL Server 2017 CU14 we have a new lightweight Extended Event (query_post_execution_plan_profile) which records the information of the actual execution plan. It is lightweight as it does not record wait types, heavy CPU and I/O metrics.
The script to create (I have set a threshold of 5 seconds and above):
CREATE EVENT SESSION [query_post_execution_plan_profile] ON SERVER
ADD EVENT sqlserver.query_post_execution_plan_profile(SET collect_database_name=(0)
    ACTION(sqlserver.client_hostname,sqlserver.database_name,sqlserver.plan_handle,sqlserver.sql_text)
    WHERE ([package0].[greater_than_equal_uint64]([duration],(5000000))))
ADD TARGET package0.event_file(SET filename=N'c:\xevents\query_post_execution_plan_profile')
WITH (MAX_MEMORY=4096 KB,EVENT_RETENTION_MODE=ALLOW_SINGLE_EVENT_LOSS,MAX_DISPATCH_LATENCY=5 SECONDS,MAX_EVENT_SIZE=0 KB,MEMORY_PARTITION_MODE=NONE,TRACK_CAUSALITY=OFF,STARTUP_STATE=ON)
GO

alter event session query_post_execution_plan_profile on server state=start;
go
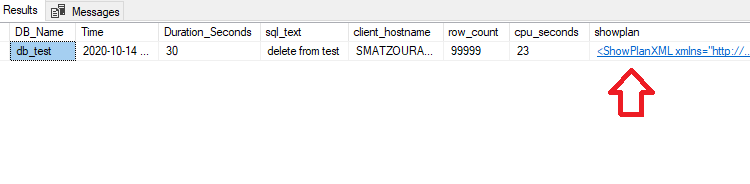
To see the results with a single query that I painstakingly wrote to read the XML of the Extended Event:
declare
@xel as varchar(max),
@xem as varchar(max),
@xm as XML

set @xel=(select
SUBSTRING(cast(f.value as varchar(max)),1,len(cast(f.value as varchar(max)))-4)+'*.xel' as xel
from sys.server_event_session_fields f
inner join sys.server_event_sessions n on f.event_session_id = n.event_session_id
WHERE f.NAME = 'filename'
and n.name like '%post%') --Set xevent Name

set @xem=(select
SUBSTRING(cast(f.value as varchar(max)),1,len(cast(f.value as varchar(max)))-4)+'*.xem' as xem
from sys.server_event_session_fields f
inner join sys.server_event_sessions n on f.event_session_id = n.event_session_id
WHERE f.NAME = 'filename'
and n.name like '%post%')  --Set xevent Name

;WITH XEvents AS
(
select  object_name, TRY_CAST(event_data AS XML) AS A FROM sys.fn_xe_file_target_read_file(
@xel
,@xem
, NULL, NULL)
)

SELECT
A.value ('(/event/action[@name=''database_name'']/value)[1]', 'VARCHAR(MAX)') AS DB_Name,
DATEADD(HOUR,DATEDIFF(hour,  SYSUTCDATETIME(),SYSDATETIME() ),A.value ('(/event/@timestamp)[1]', 'DATETIME')) AS [Time],
A.value ('(event/data[@name="duration"]/value)[1]','bigint') / 1000000  AS [Duration_Seconds],
A.value ('(/event/action[@name=''sql_text'']/value)[1]', 'VARCHAR(MAX)') AS sql_text,
--A.value ('(/event/action[@name=''query_hash_signed'']/value)[1]', 'VARCHAR(MAX)') AS query_hash_signed,
--A.value ('(/event/action[@name=''query_plan_hash_signed'']/value)[1]', 'VARCHAR(MAX)') AS query_plan_hash_signed,
A.value ('(/event/action[@name=''client_hostname'']/value)[1]', 'VARCHAR(MAX)') AS client_hostname,
A.value('(event/data[@name="estimated_rows"]/value)[1]','bigint') AS row_count,
A.value('(/event/data[@name=''cpu_time'']/value)[1]','bigint') /1000000 AS cpu_seconds,
z.fragment.query('.') as showplan,
A.value ('(/event/action[@name=''plan_handle'']/value)[1]', 'VARCHAR(MAX)') AS plan_handle,
A  AS xml_report
from XEvents
CROSS APPLY A.nodes('/event/data[@name="showplan_xml"]/value/*') as z(fragment)
where  1=1
--and DATEADD(HOUR,DATEDIFF(hour,  SYSUTCDATETIME(),SYSDATETIME() ),A.value ('(/event/@timestamp)[1]', 'DATETIME'))  between '2020-05-20 10:45:00.000' and '2020-05-22 12:45:00.000'
--and A.value ('(/event/action[@name=''database_name'']/value)[1]', 'VARCHAR(MAX)') ='DB_test'
--and A.value('(event/data[@name="duration"]/value)[1]','bigint') / 1000000  >= 10 --sec
As we can see, it also brings us the shot that ran and by simply double-clicking on the hyperlink we will see its graphic.