How do we find what features each SQL Server instance has?

In this article we will see a query that I have made so that we can easily find the specs of each SQL Server instance. This query can run in any version without needing any conversion as it is dynamic.
What can we see through this query?
- The Server name with the door
- What version is
- Which patch is installed
- The server collation
- The CPU number
- The Physical RAM that the machine has and the Max-Min memory that we have configured for the instance
- The average CPU load of the last hour through the default extended event that SQL Server has installed System Health
- The total size of the databases (Data and Log files)
- When was the last instance start-up?
- If it is enabled DAC
- The price we have set for Max DOP, blocked process threshold and cost threshold for parallelism
- Performance counters such as Page Life Expectancy, the Buffer cache hit ratio and other.
But there is a problem
As the field to find the size of RAM on the machine changed in the newer versions its name from physical_memory_in_bytes in physical_memory_kb in the view sys.configurations the query must be written dynamically. That is, to run a different query depending on the version we have.
Along with this change came the addition of availability groups. So I just check if this object exists and one of the two queries runs accordingly. Alternatively, of course, we can look at it ResourceVersion if it is before version 11 (SQL Server 2012).
The query
set nocount on
SET QUOTED_IDENTIFIER ON;
GO
declare
@query1 varchar(max),
@query2 varchar(max),
@final varchar(max)

set @query1 = 'SELECT
 @@servername AS [ServerName],
 (select distinct top 1 local_tcp_port from sys.dm_exec_connections where local_tcp_port is not null) as Port,
   CASE
     WHEN CONVERT(VARCHAR(128), SERVERPROPERTY (''productversion'')) like ''8%'' THEN ''SQL2000''
     WHEN CONVERT(VARCHAR(128), SERVERPROPERTY (''productversion'')) like ''9%'' THEN ''SQL2005''
     WHEN CONVERT(VARCHAR(128), SERVERPROPERTY (''productversion'')) like ''10.0%'' THEN ''SQL2008''
     WHEN CONVERT(VARCHAR(128), SERVERPROPERTY (''productversion'')) like ''10.5%'' THEN ''SQL2008 R2''
     WHEN CONVERT(VARCHAR(128), SERVERPROPERTY (''productversion'')) like ''11%'' THEN ''SQL2012''
     WHEN CONVERT(VARCHAR(128), SERVERPROPERTY (''productversion'')) like ''12%'' THEN ''SQL2014''
     WHEN CONVERT(VARCHAR(128), SERVERPROPERTY (''productversion'')) like ''13%'' THEN ''SQL2016''
     WHEN CONVERT(VARCHAR(128), SERVERPROPERTY (''productversion'')) like ''14%'' THEN ''SQL2017''
     WHEN CONVERT(VARCHAR(128), SERVERPROPERTY (''productversion'')) like ''15%'' THEN ''SQL2019''
     WHEN CONVERT(VARCHAR(128), SERVERPROPERTY (''productversion'')) like ''16%'' THEN ''SQL2022''
     ELSE ''unknown''
  END AS MajorVersion,
 SERVERPROPERTY(''Edition'') AS [Edition],SERVERPROPERTY(''ProductVersion'') AS ProductVersion,SERVERPROPERTY(''ProductLevel'') AS ProductLevel,SERVERPROPERTY(''ProductUpdateLevel'') AS ProductUpdateLevel
,SERVERPROPERTY(''Collation'') as [Server Collation]
,cpu_count AS [Number of Logical CPU]
--,hyperthread_ratio
--,cpu_count/hyperthread_ratio AS [Number of Physical CPU]
,physical_memory_in_bytes/1024/1024/1024  as [Physical Memory (GB)]
,(SELECT cast(value_in_use as integer)/1024
FROM sys.configurations
WHERE name = ''max server memory (MB)'') as [Max Instance memory GB]
,(SELECT cast(value_in_use as integer)/1024
FROM sys.configurations
WHERE name = ''min server memory (MB)'') as [Min Instance memory GB]
,(select CAST( ((SUM(cast(size as bigint))* 8) / 1024.0 / 1024.0) as DECIMAL(18,2)) as [Total Data Size (GB)] from sys.master_files where type_desc = ''ROWS'') as [Total Data Size (GB)]
,(select CAST( ((SUM(cast(size as bigint))* 8) / 1024.0 / 1024.0) as DECIMAL(18,2)) as [Total Log Size (GB)] from sys.master_files where type_desc = ''LOG'') as [Total Log Size (GB)]
,(SELECT
                        100-AVG(record.value(''(./Record/SchedulerMonitorEvent/SystemHealth/SystemIdle)[1]'', ''INT'') )
          FROM (
                        SELECT  top 60 CONVERT(xml, record) AS [record]
                        FROM sys.dm_os_ring_buffers
                        WHERE ring_buffer_type = N''RING_BUFFER_SCHEDULER_MONITOR''
                        AND record LIKE ''%<SystemHealth>%''
			order by timestamp desc) AS x )[AVG CPU Load Last Hour],
(select cntr_value from sys.dm_os_performance_counters
where counter_name =''Page life expectancy'' and object_name like ''%Buffer Manager%'') as [Page Life Expectancy],
(select cntr_value from sys.dm_os_performance_counters
where counter_name =''Memory Grants Pending'' and object_name like ''%Buffer Manager%'') as [Memory Grants Pending],
(SELECT ((a.cntr_value * 100) / b.cntr_value) as Value FROM sys.dm_os_performance_counters  a
JOIN (SELECT cntr_value, OBJECT_NAME FROM sys.dm_os_performance_counters WHERE counter_name = ''Buffer cache hit ratio base'' AND OBJECT_NAME LIKE ''%:Buffer Manager%'') b ON  a.OBJECT_NAME = b.OBJECT_NAME
WHERE a.counter_name = ''Buffer cache hit ratio'' AND a.OBJECT_NAME LIKE ''%:Buffer Manager%'') as [Buffer cache hit ratio],
(select Cast(cast(cntr_value as float)/(SELECT cast (DATEDIFF(s, sqlserver_start_time, GETDATE()) as float) FROM sys.dm_os_sys_info) as decimal (10,2)) as value  from sys.dm_os_performance_counters
where counter_name = ''Batch Requests/sec'') as [AVG BatchRequests/sec],
(select Cast(cast(cntr_value as float)/(SELECT cast (DATEDIFF(s, sqlserver_start_time, GETDATE()) as float) FROM sys.dm_os_sys_info) as decimal (10,2)) as Value from sys.dm_os_performance_counters
where counter_name = ''SQL Compilations/sec'') as [AVG SQL Compilations/sec],
(select Cast(cast(cntr_value as float)/(SELECT cast (DATEDIFF(s, sqlserver_start_time, GETDATE()) as float) FROM sys.dm_os_sys_info) as decimal (10,2))  as Value from sys.dm_os_performance_counters
where counter_name = ''SQL Re-Compilations/sec'') as [AVG SQL Re-Compilations/sec],
(select Cast(cast(cntr_value as float)/(SELECT cast (DATEDIFF(s, sqlserver_start_time, GETDATE()) as float) FROM sys.dm_os_sys_info) as decimal (10,2))  as Value from sys.dm_os_performance_counters
where counter_name = ''Page Splits/sec'') as [AVG Page Splits/sec],
sqlserver_start_time as [SQL Server Start Time]
,(SELECT value_in_use
FROM sys.configurations
WHERE name = ''remote admin connections'') as [remote admin connections]
,(SELECT value_in_use
FROM sys.configurations
WHERE name = ''blocked process threshold (s)'') as [blocked proccess threshold]
,(SELECT value_in_use
FROM sys.configurations
WHERE name = ''max degree of parallelism'') as [max degree of parallelism]
,(SELECT value_in_use
FROM sys.configurations
WHERE name = ''cost threshold for parallelism'') as [cost threshold for parallelism]
FROM sys.dm_os_sys_info  OPTION (RECOMPILE)'


set @query2 = 'SELECT
 @@servername AS [ServerName],
 (select distinct top 1 local_tcp_port from sys.dm_exec_connections where local_tcp_port is not null) as Port,
   CASE
     WHEN CONVERT(VARCHAR(128), SERVERPROPERTY (''productversion'')) like ''8%'' THEN ''SQL2000''
     WHEN CONVERT(VARCHAR(128), SERVERPROPERTY (''productversion'')) like ''9%'' THEN ''SQL2005''
     WHEN CONVERT(VARCHAR(128), SERVERPROPERTY (''productversion'')) like ''10.0%'' THEN ''SQL2008''
     WHEN CONVERT(VARCHAR(128), SERVERPROPERTY (''productversion'')) like ''10.5%'' THEN ''SQL2008 R2''
     WHEN CONVERT(VARCHAR(128), SERVERPROPERTY (''productversion'')) like ''11%'' THEN ''SQL2012''
     WHEN CONVERT(VARCHAR(128), SERVERPROPERTY (''productversion'')) like ''12%'' THEN ''SQL2014''
     WHEN CONVERT(VARCHAR(128), SERVERPROPERTY (''productversion'')) like ''13%'' THEN ''SQL2016''
     WHEN CONVERT(VARCHAR(128), SERVERPROPERTY (''productversion'')) like ''14%'' THEN ''SQL2017''
     WHEN CONVERT(VARCHAR(128), SERVERPROPERTY (''productversion'')) like ''15%'' THEN ''SQL2019''
     WHEN CONVERT(VARCHAR(128), SERVERPROPERTY (''productversion'')) like ''16%'' THEN ''SQL2022''
     ELSE ''unknown''
  END AS MajorVersion,
 SERVERPROPERTY(''Edition'') AS [Edition],SERVERPROPERTY(''ProductVersion'') AS ProductVersion,SERVERPROPERTY(''ProductLevel'') AS ProductLevel,SERVERPROPERTY(''ProductUpdateLevel'') AS ProductUpdateLevel
,SERVERPROPERTY(''Collation'') as [Server Collation]
,cpu_count AS [Number of Logical CPU]
--,hyperthread_ratio
--,cpu_count/hyperthread_ratio AS [Number of Physical CPU]
,physical_memory_kb/1024/1024 as [Physical Memory (GB)]
,(SELECT cast(value_in_use as integer)/1024
FROM sys.configurations
WHERE name = ''max server memory (MB)'') as [Max Instance memory GB]
,(SELECT cast(value_in_use as integer)/1024
FROM sys.configurations
WHERE name = ''min server memory (MB)'') as [Min Instance memory GB]
,(select CAST( ((SUM(cast(size as bigint))* 8) / 1024.0 / 1024.0) as DECIMAL(18,2)) as [Total Data Size (GB)] from sys.master_files where type_desc = ''ROWS'') as [Total Data Size (GB)]
,(select CAST( ((SUM(cast(size as bigint))* 8) / 1024.0 / 1024.0) as DECIMAL(18,2)) as [Total Log Size (GB)] from sys.master_files where type_desc = ''LOG'') as [Total Log Size (GB)]
,
   (SELECT
                        100-AVG(record.value(''(./Record/SchedulerMonitorEvent/SystemHealth/SystemIdle)[1]'', ''INT'') )
          FROM (
                        SELECT top 60 CONVERT(xml, record) AS [record]
                        FROM sys.dm_os_ring_buffers
                        WHERE ring_buffer_type = N''RING_BUFFER_SCHEDULER_MONITOR''
                        AND record LIKE ''%<SystemHealth>%''
			order by timestamp desc) AS x )[AVG CPU Load Last Hour],
(select cntr_value from sys.dm_os_performance_counters
where counter_name =''Page life expectancy'' and object_name like ''%Buffer Manager%'') as [Page Life Expectancy],
(select cntr_value from sys.dm_os_performance_counters
where counter_name =''Memory Grants Pending'' and object_name like ''%Buffer Manager%'') as [Memory Grants Pending],
(SELECT ((a.cntr_value * 100) / b.cntr_value) as Value FROM sys.dm_os_performance_counters  a
JOIN (SELECT cntr_value, OBJECT_NAME FROM sys.dm_os_performance_counters WHERE counter_name = ''Buffer cache hit ratio base'' AND OBJECT_NAME LIKE ''%:Buffer Manager%'') b ON  a.OBJECT_NAME = b.OBJECT_NAME
WHERE a.counter_name = ''Buffer cache hit ratio'' AND a.OBJECT_NAME LIKE ''%:Buffer Manager%'') as [Buffer cache hit ratio],
(select Cast(cast(cntr_value as float)/(SELECT cast (DATEDIFF(s, sqlserver_start_time, GETDATE()) as float) FROM sys.dm_os_sys_info) as decimal (10,2)) as value  from sys.dm_os_performance_counters
where counter_name = ''Batch Requests/sec'') as [AVG BatchRequests/sec],
(select Cast(cast(cntr_value as float)/(SELECT cast (DATEDIFF(s, sqlserver_start_time, GETDATE()) as float) FROM sys.dm_os_sys_info) as decimal (10,2)) as Value from sys.dm_os_performance_counters
where counter_name = ''SQL Compilations/sec'') as [AVG SQL Compilations/sec],
(select Cast(cast(cntr_value as float)/(SELECT cast (DATEDIFF(s, sqlserver_start_time, GETDATE()) as float) FROM sys.dm_os_sys_info) as decimal (10,2))  as Value from sys.dm_os_performance_counters
where counter_name = ''SQL Re-Compilations/sec'') as [AVG SQL Re-Compilations/sec],
(select Cast(cast(cntr_value as float)/(SELECT cast (DATEDIFF(s, sqlserver_start_time, GETDATE()) as float) FROM sys.dm_os_sys_info) as decimal (10,2))  as Value from sys.dm_os_performance_counters
where counter_name = ''Page Splits/sec'') as [AVG Page Splits/sec],
sqlserver_start_time as [SQL Server Start Time]
,(SELECT value_in_use
FROM sys.configurations
WHERE name = ''remote admin connections'') as [remote admin connections]
,(SELECT value_in_use
FROM sys.configurations
WHERE name = ''blocked process threshold (s)'') as [blocked proccess threshold]
,(SELECT value_in_use
FROM sys.configurations
WHERE name = ''max degree of parallelism'') as [max degree of parallelism]
,(SELECT value_in_use
FROM sys.configurations
WHERE name = ''cost threshold for parallelism'') as [cost threshold for parallelism]
FROM sys.dm_os_sys_info  OPTION (RECOMPILE)'


IF NOT EXISTS (SELECT 1
           FROM sys.system_objects WITH (NOLOCK)
           WHERE NAME='dm_hadr_database_replica_states')
begin set @final = @query1 end
else
begin set @final = @query2 end


exec (@final)
The result appears as we see below:

How can we run it on all the instances we have?
The easiest way is to have it set to SQL Server Management Studio all our connections to the instances and run the query on all of them together.
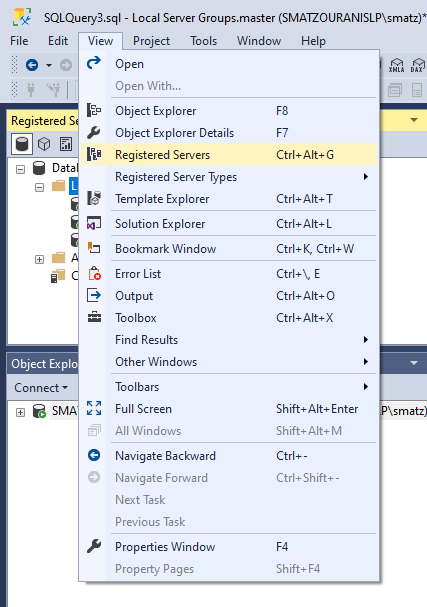
To do this we go to View, Registered Servers:
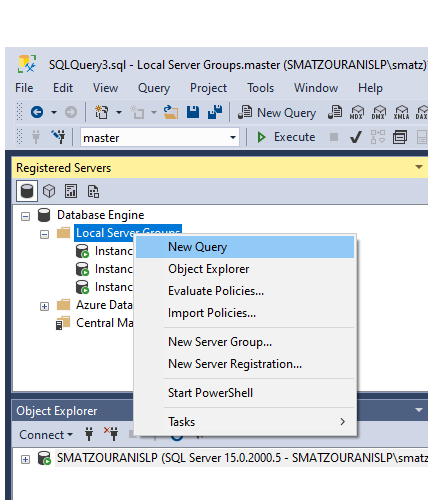
There we choose under the Database Engine, right click on Local Server Groups and we press on New Server Registration…:
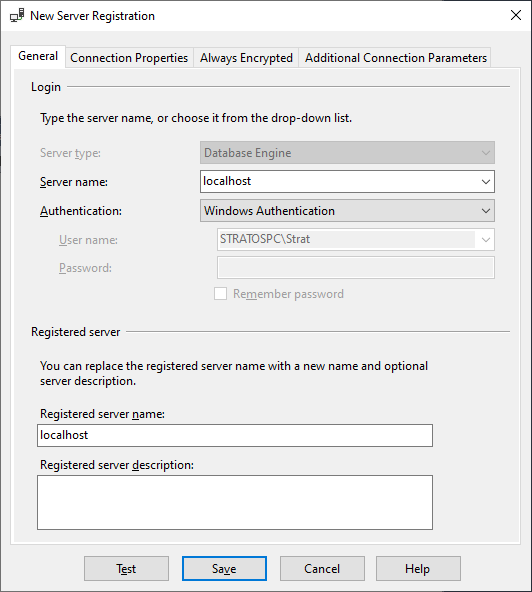
This is how we start filling all the servers we have. We only need the ServerName with its port and the credentials we connect to:
After adding the ones we want, we simply right-click on the folder we added them to (Local Server Groups) and New Query:

By adding the query to this new window and executing it, it will run us in a result set all the information we want:
*Because the machine I ran the query on didn't have access to other instances, I just went through the registered servers three times the same for the example.


