How do we collect the actual execution plan from queries using Extended Event and how do we read its data
Certifications:

In older article we had seen how to activate it Query Store to monitor the performance of the queries and the schedule they ran. But as we said the Query Store has quite a performance impact so we may want some lightweight profiling. In this article we will see how we activate the Extended Event that records this information.
You name it query_post_execution_plan_profile and enable from versions SQL Server 2019 / SQL Server 2017 CU14 and then.
It records the information of the actual execution plan. It is lightweight as it does not record wait types, heavy CPU and I/O metrics.
To create the Extended Event
We must not forget to change the path to the one where we want the data to be stored.
All we need to do is run the following T-SQL command. After it is created, it will record in the path that we have declared to it in an XML file all queries that had a duration of more than 5 seconds.
CREATE EVENT SESSION [query_post_execution_plan_profile] ON SERVER
ADD EVENT sqlserver.query_post_execution_plan_profile(SET collect_database_name=(0)
    ACTION(sqlserver.client_hostname,sqlserver.database_name,sqlserver.plan_handle,sqlserver.sql_text)
    WHERE ([package0].[greater_than_equal_uint64]([duration],(5000000))))
ADD TARGET package0.event_file(SET filename=N'c:\xevents\query_post_execution_plan_profile')
WITH (MAX_MEMORY=4096 KB,EVENT_RETENTION_MODE=ALLOW_SINGLE_EVENT_LOSS,MAX_DISPATCH_LATENCY=5 SECONDS,MAX_EVENT_SIZE=0 KB,MEMORY_PARTITION_MODE=NONE,TRACK_CAUSALITY=OFF,STARTUP_STATE=ON)
GO

alter event session query_post_execution_plan_profile on server state=start;
go
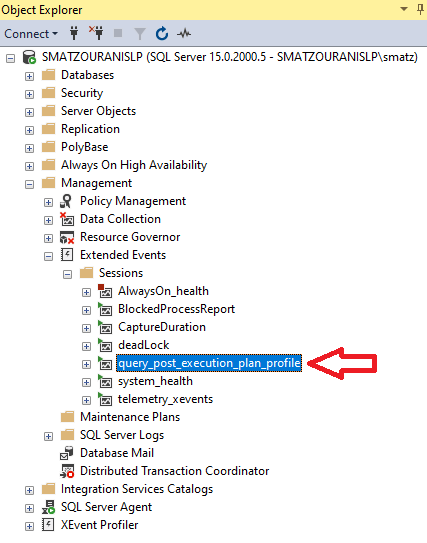
We check in the Object Explorer that the Extended Event is running (it is green), if it is not, right click on it and start session.
How we read the results
In the path we defined during its creation XEvent a .xel and a .xem file were created. Through the dynamic view sys.fn_xe_file_target_read_file with parameters these files we result in all the XML file with the information.
But since it is impractical to read an XML by eye, the file must somehow be filtered into a more readable form.
So I sat down and made a query that does this job.
For starters, through the name we created, Xevent finds the path that is dynamically located and defines it as a parameter in the query.
Then we define the XML as one Common Table Expression. By doing SELECT we can get the value from each property we need.
In the where statement we can filter specific bases, the duration and the period of time it was executed.
This part needs attention, as the default xml timestamp is in UTC timezone, so to put the real time that the server has, we add the time difference that the server has with the UTC timezone (DATEADD(HOUR,DATEDIFF(hour, SYSUTCDATETIME(),SYSDATETIME() )).
declare
@xel as varchar(max),
@xem as varchar(max),
@xm as XML

set @xel=(select
SUBSTRING(cast(f.value as varchar(max)),1,len(cast(f.value as varchar(max)))-4)+'*.xel' as xel
from sys.server_event_session_fields f
inner join sys.server_event_sessions n on f.event_session_id = n.event_session_id
WHERE f.NAME = 'filename'
and n.name like '%post%') --Set xevent Name

set @xem=(select
SUBSTRING(cast(f.value as varchar(max)),1,len(cast(f.value as varchar(max)))-4)+'*.xem' as xem
from sys.server_event_session_fields f
inner join sys.server_event_sessions n on f.event_session_id = n.event_session_id
WHERE f.NAME = 'filename'
and n.name like '%post%')  --Set xevent Name

;WITH XEvents AS
(
select  object_name, CAST(event_data AS XML) AS A FROM sys.fn_xe_file_target_read_file(
@xel
,@xem
, NULL, NULL)
)

SELECT
A.value ('(/event/action[@name=''database_name'']/value)[1]', 'VARCHAR(MAX)') AS DB_Name,
DATEADD(HOUR,DATEDIFF(hour,  SYSUTCDATETIME(),SYSDATETIME() ),A.value ('(/event/@timestamp)[1]', 'DATETIME')) AS [Time],
A.value ('(event/data[@name="duration"]/value)[1]','bigint') / 1000000  AS [Duration_Seconds],
A.value ('(/event/action[@name=''sql_text'']/value)[1]', 'VARCHAR(MAX)') AS sql_text,
--A.value ('(/event/action[@name=''query_hash_signed'']/value)[1]', 'VARCHAR(MAX)') AS query_hash_signed,
--A.value ('(/event/action[@name=''query_plan_hash_signed'']/value)[1]', 'VARCHAR(MAX)') AS query_plan_hash_signed,
A.value ('(/event/action[@name=''client_hostname'']/value)[1]', 'VARCHAR(MAX)') AS client_hostname,
A.value('(event/data[@name="estimated_rows"]/value)[1]','bigint') AS row_count,
A.value('(/event/data[@name=''cpu_time'']/value)[1]','bigint') /1000000 AS cpu_seconds,
z.fragment.query('.') as showplan,
A.value ('(/event/action[@name=''plan_handle'']/value)[1]', 'VARCHAR(MAX)') AS plan_handle,
A  AS xml_report
from XEvents
CROSS APPLY A.nodes('/event/data[@name="showplan_xml"]/value/*') as z(fragment)
where  1=1
--and DATEADD(HOUR,DATEDIFF(hour,  SYSUTCDATETIME(),SYSDATETIME() ),A.value ('(/event/@timestamp)[1]', 'DATETIME'))  between '2020-05-20 10:45:00.000' and '2020-05-22 12:45:00.000'
--and A.value ('(/event/action[@name=''database_name'']/value)[1]', 'VARCHAR(MAX)') ='mig_db'
--and A.value('(event/data[@name="duration"]/value)[1]','bigint') / 1000000  >= 10 --sec
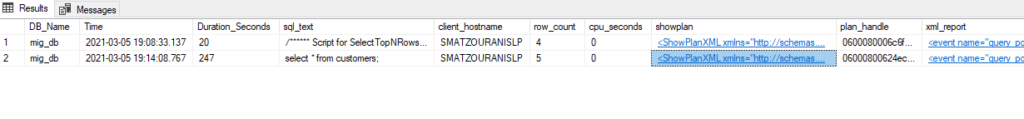
The result
The result of the query brought us for this period of time, on the database we asked for, the queries that ran for more than 5 seconds, on which database they ran, for how long, the sql text, where they ran from, how many records they brought and the execution plan they ran.
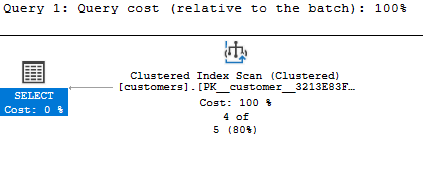
Selecting the hyperlink in each one will open the graphic from the execution plan it had.