How to force a plan in an Oracle database

- How to convert a database from Physical Standby to Logical Standby in Oracle Data Guard - 2 June 2025
- How to roll back an Oracle Database using a restore point in a Data Guard environment - 28 April 2025
- How can we increase performance on Oracle GoldenGate Replicat target with parallelism? - 19 March 2025
In previous article we have seen why a query can run with a different plan and how to force one in SQL Server. In this article we will see how to force a plan in an Oracle database using SQL profile.
Because the query can run with a different plan
When the Query Optimizer chooses which plan to use depends on information such as the statistics, the amount of data, the values of the variables, the indexes that exist and the SQL Profile.
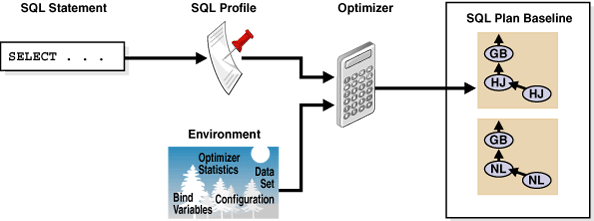
If either changes, the Optimizer will create a new plan.
Parameter sniffing and Adaptive Cursor Sharing
As in SQL Server so also in Oracle we have his problem parameter sniffing. When we run a procedure or a sql statement that accepts a parameter depending on the value, the query can return 1 line or 100,000. For the Query Optimizer to use a different plan if it increases performance Oracle has brought it Adaptive Cursor Sharing.
How to force a plan using SQL profile
That SQL Profile provides statistics for a SQL Statement and through these statistics o Query Optimizer will choose which plan to use.
We can to create a SQL Profile but so that we use some past shot which is either located in memory (library_cache) either in the system view dba_hist_sqlplan.
Carolos Sierra from Oracle Support has made a script named coe_xfr_sql_profile.sql which makes it easy to create a SQL Profile that forces a plan into a SQL Statement.
Example
Running a query twice, we see in the system view gv$sqlarea that the same SQL_ID has a very different execution time per plan. We keep it from there SQL_ID and PLAN_HASH_VALUE which is faster and we want to force.
select inst_id,sql_text,sql_fulltext,sql_id,hash_value,plan_hash_value,elapsed_time,last_load_time from gv$sqlarea
where sql_text like '%SELECT h.LOGON_TIME%'
order by sql_id;

Running a query twice we see the same query that has the same SQL_ID to have a different PLAN_HASH_VALUE that is, a different plan.
In case we don't know the SQL text but we have information about the session. Then you this article we can see how through the systemic view gv$session we will find it easily SQL_ID with the PLAN_HASH_VALUE who ran her every time.

Before we start we need to download the script first coe_xfr_sql_profile.sql.
We transfer the script to a folder and execute it by putting it SQL_ID of and the PLAN_HASH_VALUE which we will want him to have forever from now on:
@coe_xfr_sql_profile.sql 4wtpa4vzh8rpb 1851898411;
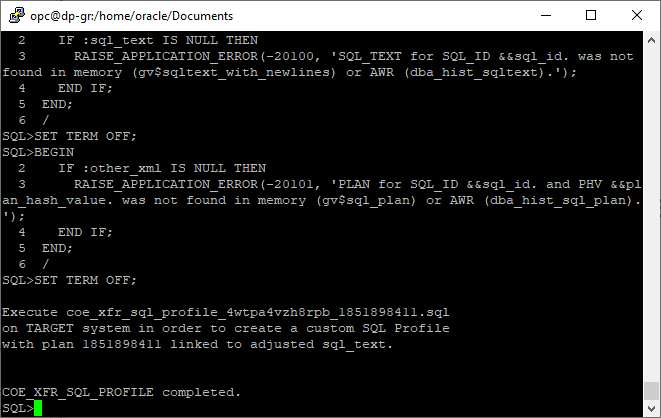
Then after we execute it, a new one will be created in the path where the script is located coe_xfr_sql_profile_sql_id.sql:
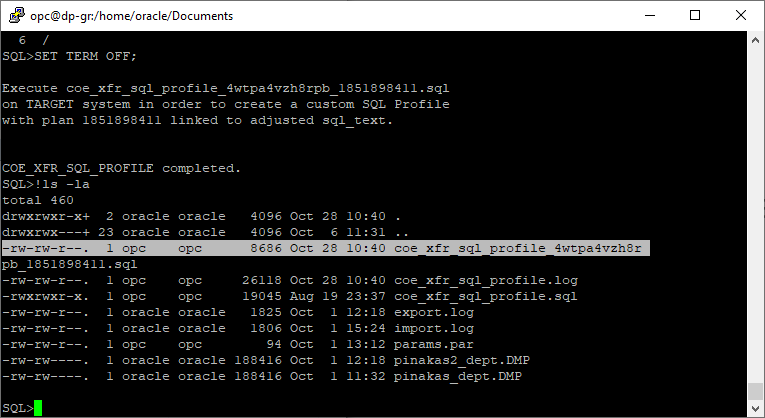
After we run this with sqlplus, the SQL Profile will be created:
@coe_xfr_sql_profile_sql_id.sql
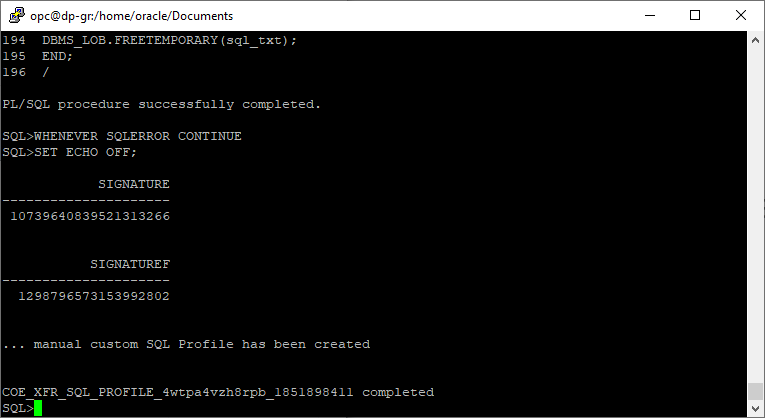
We can see that SQL Profile has been created by the view dba_sql_profiles.
select * from dba_sql_profiles where 1=1
and name like '%4wtpa4vzh8rpb%' --sqlID
--and sql_text like '%h.LOGON_TIME%'  --SQL TEXT

Now every time we execute the query it will run with the same plan.

How can we see plan changes in query over time
With the following query we can see how many times the plan of a query was changed to which one and when:
SELECT trunc(sample_time),h.session_id,h.SESSION_SERIAL#,h.sql_id, h.sql_plan_hash_value, SUM(10) ash_secs, 10*COUNT(h.sql_id) awr_secs,min(sample_time)
FROM  dba_hist_snapshot X, dba_hist_active_sess_history h
LEFT OUTER JOIN dba_hist_sqltext t ON t.sql_id = h.sql_id
WHERE 1=1
and h.sql_id='3c1kubcdjnppq'
and x.snap_id=h.snap_id
--and h.dbid=xxxxx
and x.snap_id between (select max(snap_id) - 800 from dba_hist_snapshot) and (select max(snap_id) from dba_hist_snapshot)
GROUP BY trunc(sample_time),h.session_id,h.SESSION_SERIAL#,h.sql_id, h.sql_plan_hash_value
order by min(sample_time) desc;
* However, if we do not have Oracle DB enterprise edition but standard, we will not be able to find the information from historical views, so we can only see from memory library cache with the following query.
select plan_hash_value,sql_id,timestamp from gv$sql_plan
where SQL_ID='3c1kubcdjnppq'
order by timestamp desc
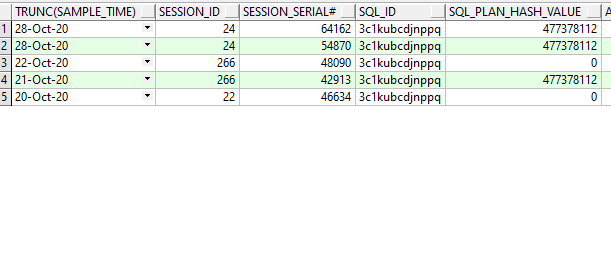
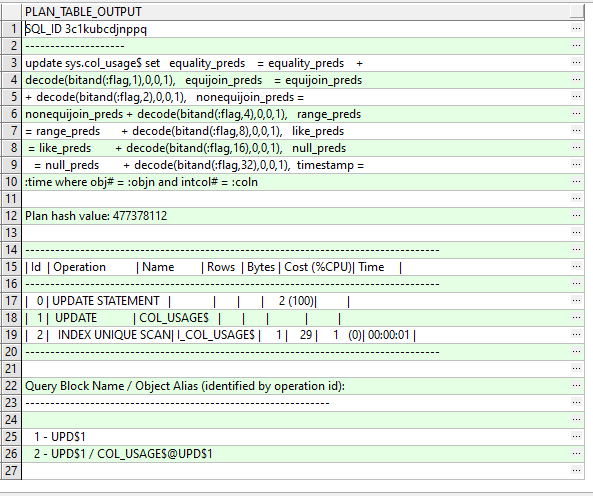
We can see the entire SQL Statement by having the SQL_ID with the complete snapshots it ran:
SELECT * from table(dbms_xplan.display_awr('3c1kubcdjnppq',null,null,'ADVANCED'));
To delete a bad shot from the SGA shared pool
In order to erase from the memory a bad plan from the SGA we should use the procedure dbms_shared_pool.purge.
First we find the value we want to delete from the view sqlarea:
select address, hash_value from gv$sqlarea where sql_id='4wtpa4vzh8rpb';
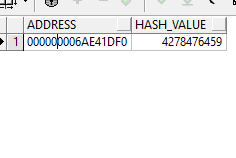
Having the information we need, we can perform the following procedure:
begin
sys.DBMS_SHARED_POOL.purge('000000006AE41DF0,4278476459', 'C');
end;
To delete the SQL Profile
If we want to delete one of the SQL Profiles we have created, then we run the following filling in the corresponding name of the SQL Profile:
begin
dbms_sqltune.drop_sql_profile('coe_4wtpa4vzh8rpb_185189411');
end;


How do you determine when an sql profile has become stale
If query performance suddenly declined.