


How memory works in PostgreSQL and what parameters do we configure?


Certifications:

- How memory works in PostgreSQL and what parameters do we configure? - 11 August 2026
- What are WALs in PostgreSQL and how do we configure them? - 6 August 2026
- What is MVCC and Vacuum in PostgreSQL database and how do we avoid Bloat? - 29 July 2026
In a previous article we have analyzed the architecture of Oracle Database (SGA/PGA). This time we will look at the PostgreSQL memory architecture and the key parameters for optimal performance.
The memory model of PostgreSQL is significantly different from that of SQL Server or Oracle Database. It is essential to know how memory is allocated to avoid errors such as Out of Memory (OOM) in the operating system.
The Memory Architecture in PostgreSQL
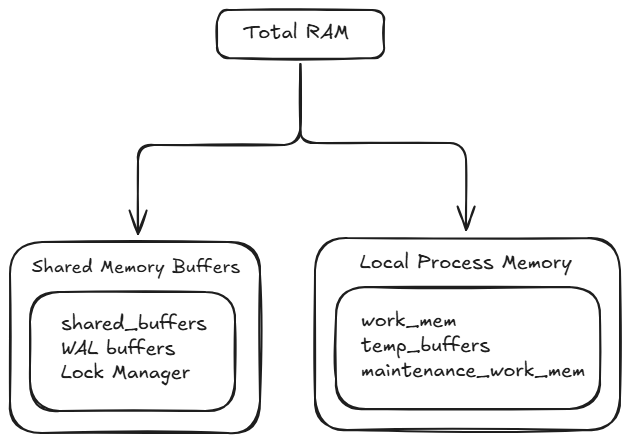
The total RAM allocated by PostgreSQL is divided into two broad categories:
Shared Memory Areas: Memory areas shared by all database processes/sessions.
Local Memory Areas: Memory areas that are reserved separately by each process for the execution of specific queries.
Shared Memory Parameters
In shared memory, the most crucial parameter is the shared_buffers, which is the main cache area for data pages and indexes (equivalent to the Buffer Pool in SQL Server or the Buffer Cache in Oracle's SGA). Its default value is usually 128MB. In SQL Server we are used to giving 80% of RAM to the database, but in PostgreSQL this is wrong, as its architecture relies heavily on the Page Cache of the Operating System itself. For this reason, the appropriate value for shared_buffers is 25% of the server's total RAM.
Another important part of Shared Memory is the Lock Manager, the special area where all locks (row-level, table-level, advisory locks, lightweight locks) held or pending by active transactions are stored. The size of memory allocated by the Lock Manager is dynamically calculated based on the parameters max_locks_per_transaction (default 64) and max_connectionsIf a query tries to acquire locks on too many tables at once and the error occurs out of shared memory, the solution is to increase the parameter max_locks_per_transaction in 128.
Finally, shared memory also includes: wal_buffers, which temporarily stores Write-Ahead Logging (WAL) data before it is written to disk, much like the Log Buffer does in other RDBMSs. Their value is automatically set to 3% in shared_buffers (with a maximum limit of 16MB) and usually we don't need to intervene manually
If we change these parameters in postgresql.conf require the service to be restarted, are not dynamic parameters.
Local Process Memory Parameters (Per Session/Query)
This is where the biggest trap for out of memory crashes lies, as these parameters do not concern the total session memory, but each individual operation.
The work_mem used for internal classification tasks (such as ORDER BY and DISTINCT) as well as for joins. Its default value is just 4MB. It is not defined once per connection, but per operation within the execution plan. This means that if a complex query performs 3 Hash Joins and 2 Sorts, it can consume up to 5 times this memory during its execution. To avoid OOM, we keep the work_mem low at grassroots level e.g. 32MBIf a specific heavy report needs more memory, we temporarily change it in the specific session and then restore it:
SET work_mem = '256MB';

RESET work_mem;
At the same time, for sessions that use temporary tables (TEMP TABLE), there is the parameter temp_buffers. Specifies the maximum amount of memory that each session can use to hold temporary table data pages in RAM, with a default value of 8MB. If a query produces large temporary tables that exceed this limit, PostgreSQL will be forced to write the remaining data to disk, causing I/O overhead. In environments with heavy ETL processes, we can increase the temp_buffers e.g. in 32MB either globally or locally to the session that is executing the process.
On the other hand, the maintenance_work_mem determines the memory used for maintenance tasks, such as CREATE INDEX, the ALTER TABLE ADD FOREIGN KEY and VACUUMIts default value is 64MB, but since maintenance tasks are performed infrequently and by individual processes, we can give a much higher value, e.g. 2GB, so that index builds and cleanups complete much faster.
Local Parameters are dynamic, the service does not need to be down if we change them in postgresql.conf just needs reload via SQL (SELECT pg_reload_conf();)
How do we control Shared Memory usage (Cache Hit Ratio)
To determine whether the memory shared_buffers sufficient or if the base is constantly reading from the disk, we monitor the Buffer Cache Hit Ratio with the following query:
SELECT
    COALESCE(sum(heap_blks_read), 0) AS disk_reads,
    COALESCE(sum(heap_blks_hit), 0)  AS buffer_hits,
    CASE
        WHEN (COALESCE(sum(heap_blks_hit), 0) + COALESCE(sum(heap_blks_read), 0)) > 0
        THEN ROUND(
            100.0 * sum(heap_blks_hit) / (sum(heap_blks_hit) + sum(heap_blks_read)),
            2
        )
        ELSE 0
    END AS cache_hit_ratio
FROM pg_statio_user_tables;
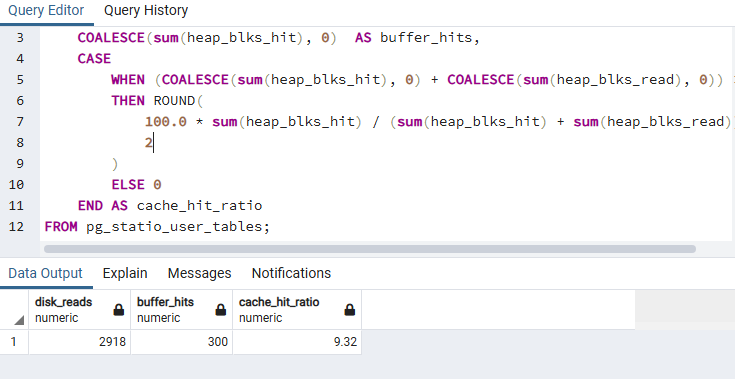
Interpretation of the result:
cache_hit_ratio > 99%: The database serves requests almost entirely from RAM.cache_hit_ratio < 95%: Increased disk I/O. Need to check for missing indexes or possible increase inshared_buffers.0% (or zero reads/hits): The database has just started or no queries have been executed on the user tables yet.