


How can we monitor performance (Oracle AWR type) in PostgreSQL with a report using the pg_profile extension?


Certifications:

- How can we monitor performance (Oracle AWR type) in PostgreSQL with a report using the pg_profile extension? - 5 October 2026
- How to enable Object and Session level Auditing in PostgreSQL - 10 August 2026
- How to upgrade PostgreSQL to a newer version - 23 September 2026
When managing PostgreSQL databases in production environments, one of the biggest challenges is identifying which queries and processes are consuming the most resources. Although PostgreSQL has great tools like pg_stat_statements, we often need historical workload reports to analyze what exactly happened on the system a few hours or days ago.
In this article we will see how we can install and configure the pg_profile, extension, which works like a kind of AWR Report Oracle for PostgreSQL, allowing us to take historical snapshots and export detailed HTML reports.
What is pg_profile?
The pg_profile is an open source extension that keeps a history of samples.
Using it, we can:
- Identify which queries lowered the database's performance in a given period of time.
- To produce ready-made HTML reports between two points in time (snapshots).
- To automate the sample collection process.
The installation
For the extension to work properly, we will first need to activate the necessary base extensions (dblink and pg_stat_statements), we must make sure that in postgresql.conf there is the library pg_stat_statements:
su postgres

vi $PGDATA/postgresql.conf
shared_preload_libraries = 'pg_stat_statements'We restart the service:
sudo systemctl restart postgresql-14
We connect to the database and activate the extensions:
CREATE EXTENSION dblink;
CREATE EXTENSION pg_stat_statements;
CREATE EXTENSION pg_profile;
How do we take a Snapshot and generate a Report?
Once the extension is installed, we can manually run a snapshot with the command:
SELECT snapshot();
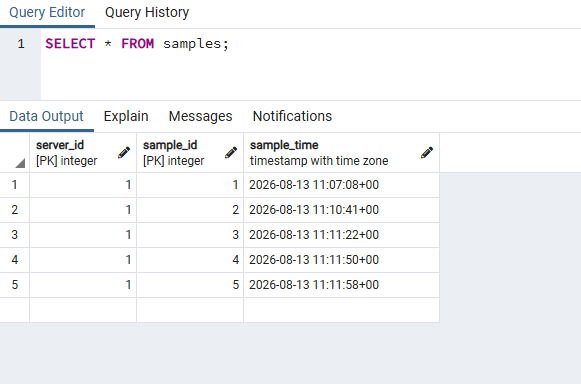
After some time has passed and we run the function again, the available samples are created. We can see their list with the following query:
SELECT *
FROM samples
ORDER BY sample_id;
Create HTML Report
To get the performance report between two snapshots (e.g. by ID 1 in ID 2), we execute:
SELECT get_report(1, 2);
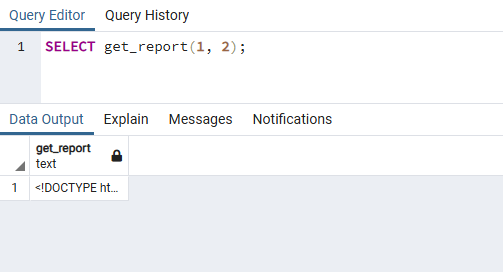
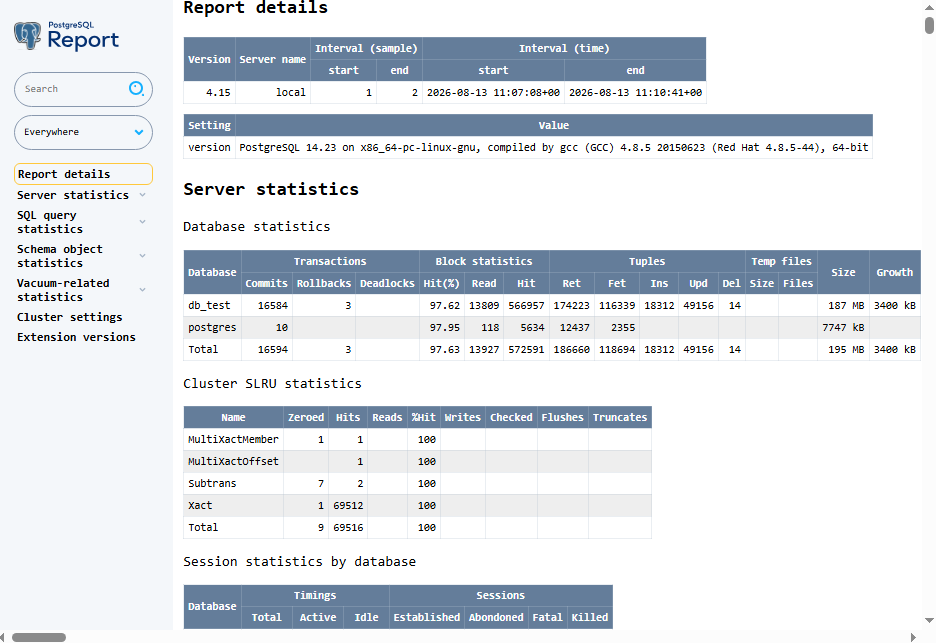
The result is HTML code, which we can copy, save to a file .html and open it in our browser to see the database statistics in detail.
Automatic Snapshots via Cron Job
Because PostgreSQL does not have an internal job scheduler, the official and most reliable way to automate taking snapshots is through cron of the Linux operating system, following the philosophy of the tool's creator.
To do this, we open the user's crontab postgres in the terminal:
sudo crontab -u postgres -e
We add the following line to automatically take a snapshot every 1 hour:
0 * * * * psql -d db_test -c "SELECT snapshot();"
Snapshot Retention
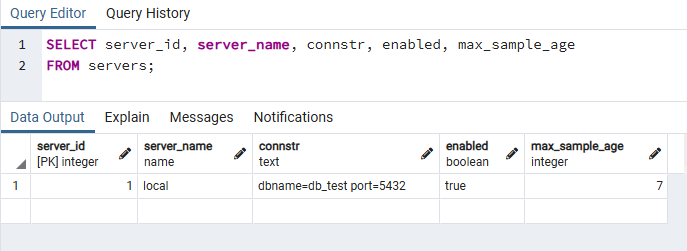
A critical issue when collecting historical performance data is avoiding uncontrolled growth of the database size. The pg_profile has a retention policy which is controlled by the parameter max_sample_age per server. For example, setting the limit to 7 days via the function:
SELECT set_server_max_sample_age('local', 7);
This way we ensure that older snapshots are cleaned up automatically by the extension itself every time the new snapshot process is executed. This way we maintain a stable storage consumption, while enjoying the necessary historical depth for our analyses without manual intervention.
To see the setting of max_sample_age, we run the following:
SELECT server_id, server_name, connstr, enabled, max_sample_age
FROM servers;
Alternatively, we can add a cron job to clean up old snapshots and have a 7-day retention:
0 2 * * * psql -d db_test -c "DELETE FROM samples WHERE sample_time < NOW() - INTERVAL '7 days';"