

How do we find which queries are currently running in a PostgreSQL database?


The journey began in 2008 where I officially started working in the field of IT (IT). Starting the first semester of school I realized a special attraction towards databases and automation. I have been involved with databases such as Microsoft SQL Server / Oracle Database / PostgreSQL, data analysis and automations using the command line (CLI), Visual Basic for Applications and Python. Through years of experience I have developed these capabilities so that I can make my life easier. For me, the purpose of every IT guy and every office worker is to have the knowledge so that through tools he can work a little but produce a lot. Through this his website DataPlatform.gr I try to offer knowledge and propose solutions to everyday problems.
Certifications:

Certifications:
Latest posts by Stratos Matzouranis (see all)
- How do we find which queries are currently running in a PostgreSQL database? - 9 November 2026
- What is TimescaleDB (Tiger Data) and how do we manage Time-Series data in PostgreSQL? - 2 November 2026
- How do we use pgvector in PostgreSQL for AI and Vector Search? - 26 October 2026
As we have seen in corresponding articles for SQL Server and Oracle Database, monitoring active queries in real time is a key tool in the hands of a DBA to identify bottlenecks, long-running queries and blocking sessions. In PostgreSQL this is done with the built-in view pg_stat_activity.
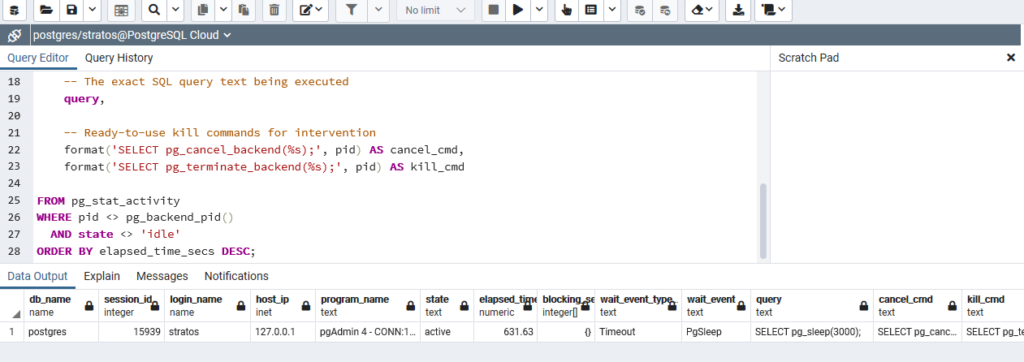
Through this query we can see the following:
db_name: Displays the database to which the process is connected and executed.session_id(pid): Uniquely identifies the backend process of the connection.login_name: The username with which the connection to the database has been made.host_ip: The IP address of the client from which the connection originates.program_name: The application or tool used to connect (e.g. pgAdmin, production application).state: The current state of the process (e.g. active, idle in transaction).elapsed_time_secs: How many seconds the current query runs.blocking_session_ids: Returns which PIDs are holding locks and blocking the specific session (equivalent toblocking_session_idin SQL Server).wait_event_type&wait_event: They show us exactly the reason for the wait (e.g. I/O, Lock, Client).query: The full text of the SQL query being executed by the process at that moment.cancel_cmd&kill_cmd: Automatically generate ready-made SQL commands (pg_cancel_backendto safely stop only the query orpg_terminate_backendfor a complete closure of the session/connection) so that we can intervene immediately in the event of a problem.
The Query
All we have to do is run the following select query:
SELECT
    current_database() AS db_name,
    pid AS session_id,
    usename AS login_name,
    client_addr AS host_ip,
    application_name AS program_name,
    state,

    ROUND(EXTRACT(EPOCH FROM (clock_timestamp() - query_start))::numeric, 2) AS elapsed_time_secs,

    pg_blocking_pids(pid) AS blocking_session_ids,

    wait_event_type,
    wait_event,
    format('SELECT pg_cancel_backend(%s);', pid) AS cancel_cmd,
    format('SELECT pg_terminate_backend(%s);', pid) AS kill_cmd

FROM pg_stat_activity
WHERE pid <> pg_backend_pid()
  AND state <> 'idle'
ORDER BY elapsed_time_secs DESC;
The result
Running the query will return results as below: